Stock Analysis · Empire State Realty OP LP ES (ESBA)
Overview
Empire State Realty OP, L.P. is the operating partnership behind Empire State Realty Trust, a New York-focused real estate investment platform. Its best-known asset is the Empire State Building, but the business is broader than a single landmark. The company owns, operates, acquires, and repositions office, retail, and multifamily properties, with a portfolio concentrated in Manhattan and the greater New York metropolitan area. It also earns revenue from the Observatory business at the Empire State Building, which gives the company an income stream that most office REITs do not have.
For long-term analysis, the most important point is that this is primarily a property cash flow business tied to New York City leasing conditions, tourism demand, and balance sheet discipline. The portfolio is relatively specialized rather than nationally diversified, so company performance is closely linked to conditions in one of the world’s largest office and tourism markets.
The company’s main revenue sources are broadly split as follows, based on recent annual disclosures and segment reporting:
- Office rental revenue: approximately 65% to 75% — rent from office tenants across the Manhattan-centered portfolio, including base rent and other tenant-related billings.
- Observatory revenue: approximately 15% to 25% — ticket sales and related visitor spending tied to the Empire State Building Observatory, which is influenced by tourism trends and pricing.
- Retail rental revenue: approximately 5% to 10% — rent from street-level and destination retail space within key properties.
- Multifamily and other revenue: less than 5% — residential rents and smaller ancillary property income streams.
This revenue mix matters because it gives Empire State Realty a hybrid profile: part traditional office landlord, part tourism-linked real estate owner. That combination can create upside when New York leasing and visitor traffic are healthy, but it also means the company is exposed to two cyclical engines instead of one.
Over the past several years, revenue has generally improved from post-pandemic levels, but profit conversion has been uneven. Operating income recovered more clearly than net income, which suggests that interest expense and other non-operating items still weigh heavily on shareholder returns.
Key Figures
| Metric | Value | Sector ⓘ |
|---|---|---|
| Date | Oct 10, 2026 | |
| Context | ||
| Sector | Real Estate | |
| Industry | REIT - Office | |
| Market Cap ⓘ | $1.21B | |
| Beta ⓘ | 1.46 | |
Value (Cheapness) | ||
| P/E Ratio ⓘ | 215.50 | 17.21 |
| P/B Ratio ⓘ | 0.67 | 0.86 |
| FCF Yield ⓘ | 17.66% | 7.55% |
| Dividend Yield ⓘ | 3.26% | 4.84% |
| EBIT / EV ⓘ | 4.04% | 3.81% |
| PEG ⓘ | N/A | |
Growth (Business expansion) | ||
| Revenue Growth ⓘ | 3.20% | 5.30% |
| RPS Growth (5Y CAGR) ⓘ | 6.05% | 6.02% |
| EPS Growth (5Y CAGR) ⓘ | N/A | -11.37% |
| BVPS Growth (5Y CAGR) ⓘ | 2.88% | 0.61% |
| Margin Growth (5Y Trend) ⓘ | 12.45% | 0.40% |
| FCF Growth (5Y CAGR) ⓘ | -30.16% | 5.35% |
| DPS Growth (5Y CAGR) ⓘ | 8.82% | 5.05% |
Quality (Business durability) | ||
| ROIC (Latest) ⓘ | 2.87% | 5.69% |
| ROE (Latest) ⓘ | -0.48% | 7.56% |
| ROA (Latest) ⓘ | -0.16% | 2.85% |
| ROIC (5Y Median) ⓘ | 4.11% | 4.21% |
| ROE (5Y Median) ⓘ | 3.57% | 6.03% |
| ROA (5Y Median) ⓘ | 1.50% | 2.44% |
| Net Debt / EBIT (Latest) ⓘ | 16.24 | 7.66 |
| Net Debt / EBIT (5Y Median) ⓘ | 12.68 | 8.42 |
| Net Debt / EBITDA (Latest) ⓘ | 6.57 | 5.27 |
| Net Debt / Assets ⓘ | 50.98% | 37.76% |
| EBITDA / Interest ⓘ | 1.25 | 4.10 |
| Operating Margin (Latest) ⓘ | 17.10% | 35.18% |
| Operating Margin (5Y Median) ⓘ | 21.83% | 37.31% |
| Debt to Equity (Latest) ⓘ | 126.49% | 88.87% |
| Profit Margin (Latest) ⓘ | 1.18% | 19.61% |
| Free Cash Flow (Latest) ⓘ | $213.30M | |
Momentum (Price trend) | ||
| 3Y Return ⓘ | -39.03% | +30.71% |
| 12M Return (excl. last month) ⓘ | -42.44% | +6.58% |
| 6M Return ⓘ | -7.26% | -1.74% |
| Price vs. 200-Day MA ⓘ | -15.39% | -3.29% |
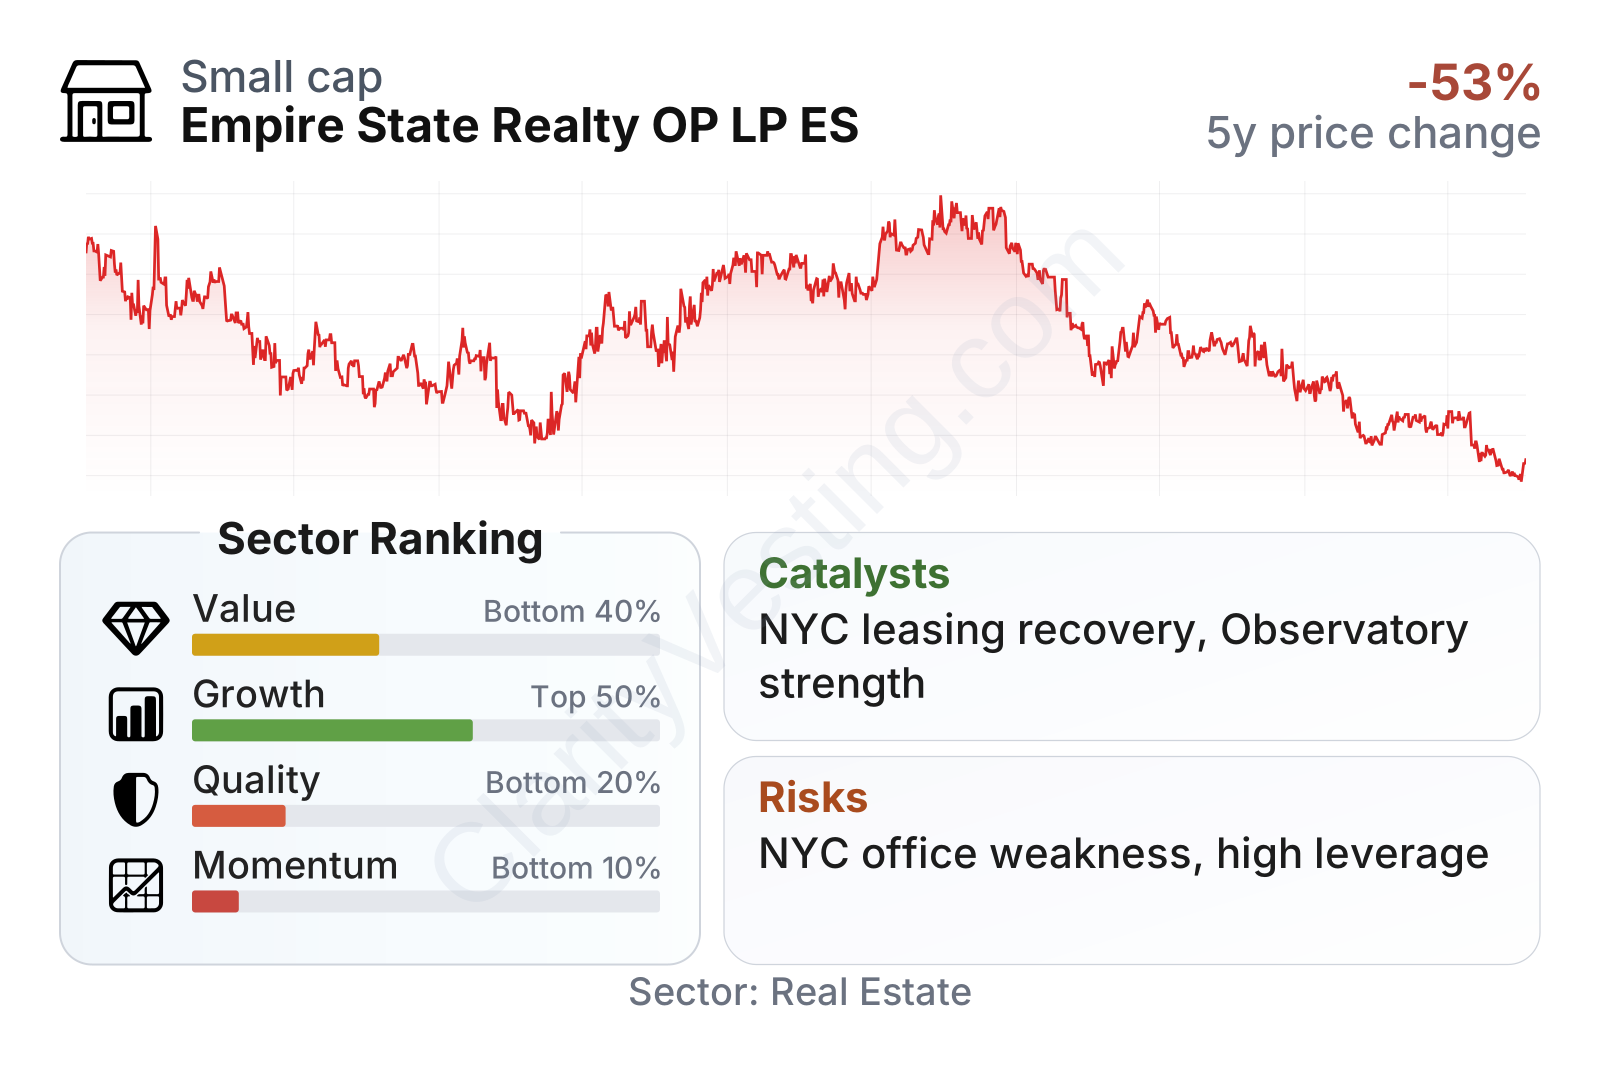
The market is treating the company cautiously. The stock has lost substantial ground over the last one-, three-, and recent six-month periods, placing momentum near the bottom of the real estate sector. At the same time, the balance between value signals is mixed: the shares trade below sector median book value multiples, but the earnings multiple looks unusually high because net profit is currently thin. Free cash flow generation stands out better than the headline earnings figure, while quality metrics such as returns on assets and equity remain weak relative to peers.
Empire State Realty is a mid-sized REIT rather than a large diversified real estate giant. Its beta is elevated, meaning the stock has tended to move more sharply than the broader market. For long-term readers, that combination usually signals that business fundamentals and sentiment around New York office real estate can both have an outsized impact on share performance.
Growth
Empire State Realty operates in a sector that has been under pressure rather than in a broadly expanding segment of real estate. U.S. office property remains one of the most debated areas in the market because hybrid work has reduced demand in many cities. That said, the company is concentrated in high-quality New York assets, and prime, transit-connected buildings have generally held up better than lower-tier offices. In other words, the sector backdrop is difficult, but the company’s asset quality gives it a more defensible position than many weaker office landlords.
The strategy for future growth is logical even if it is not high-growth in the classic sense. Management has focused on modernizing buildings, improving energy efficiency, leasing space in a selective way, and using the Observatory as a differentiated earnings source. That approach aims to preserve occupancy and rent levels while keeping the Empire State Building and other major properties competitive. In a challenged office environment, protecting asset relevance is often more important than simply adding more square footage.
Revenue per share has trended upward over the last five years, though the pace has slowed recently. That pattern suggests the business has made a real recovery from earlier disruption, but it has not yet returned to a clearly accelerating growth phase. The latest year appears closer to stabilization than breakout expansion.
The dividend per share has increased meaningfully compared with 2021, although the trajectory has not been perfectly smooth. That points to improving cash distribution capacity over time, but also reflects the reality that management is balancing shareholder payouts against the need to manage leverage and property investment.
Potential catalysts are specific rather than broad. A stronger Manhattan leasing market, continued premium pricing and traffic at the Observatory, and further improvement in occupancy across the portfolio could all help earnings quality. The company may also benefit if interest rates become more favorable for refinancing or if public market sentiment toward office REITs improves from very depressed levels.
Recent company updates and filings have continued to emphasize leasing execution, portfolio repositioning, and New York market resilience rather than transformational expansion. That is important context: the opportunity here is more about recovery, asset monetization, and cash flow durability than about a new business line dramatically changing the company’s scale.
Risks
This article is for informational purposes only and does not constitute financial advice. Some content is AI-generated. See Disclaimer


