Stock Analysis · ERock Inc (EROC)
Overview
ERock Inc operates in specialty industrial machinery, but the current business profile is more specific than that label suggests. Based on its recent public filings, the company is focused on equipment and systems tied to critical industrial and infrastructure applications, with an emphasis on electrification and energy-related end markets. That positioning matters because demand in these areas is often driven by long project cycles, utility and industrial capital spending, and replacement needs rather than short-lived consumer trends.
The company’s revenue base appears concentrated in its core equipment and project-related activities. Public disclosures do not provide a simple, highly detailed revenue split across many subcategories in the material reviewed, so the clearest reliable breakdown is at a higher level: product and system sales remain the dominant source, while service, support, and other related activities appear to make up a smaller share. In practical terms, the business can be understood as follows:
- Equipment and system sales: the large majority of revenue, generated from industrial machinery, engineered systems, and related customer projects.
- Aftermarket, service, and other activities: a smaller portion of revenue, incorporating maintenance, support, and other ancillary work where applicable.
One important point from the recent financial flow is that ERock lifted revenue meaningfully from 2024 to 2025, and gross profit also improved. At the same time, operating costs remained heavy enough to keep the company in an operating loss position. That means the central issue is not whether the company can sell more, but whether it can scale those sales into durable profitability.
The financial flow shows a business that improved its gross profit dollars and sharply reduced interest expense, but selling and administrative costs still absorbed too much of the benefit. That pattern suggests progress in financing and commercial activity, yet it also shows how much execution still depends on cost discipline and operating leverage.
Key Figures
| Metric | Value | Sector ⓘ |
|---|---|---|
| Date | Oct 24, 2026 | |
| Context | ||
| Sector | Industrials | |
| Industry | Specialty Industrial Machinery | |
| Market Cap ⓘ | $3.32B | |
| Beta ⓘ | N/A | |
Value (Cheapness) | ||
| P/E Ratio ⓘ | 43.36 | 22.29 |
| P/B Ratio ⓘ | 12.33 | 1.98 |
| FCF Yield ⓘ | 7.78% | 6.26% |
| Dividend Yield ⓘ | N/A | 1.92% |
| EBIT / EV ⓘ | -750.18% | 4.83% |
| PEG ⓘ | N/A | |
Growth (Business expansion) | ||
| Revenue Growth ⓘ | -41.70% | 9.30% |
| RPS Growth (5Y CAGR) ⓘ | N/A | 7.76% |
| EPS Growth (5Y CAGR) ⓘ | N/A | -13.17% |
| BVPS Growth (5Y CAGR) ⓘ | N/A | 6.13% |
| Margin Growth (5Y Trend) ⓘ | N/A | 0.74% |
| FCF Growth (5Y CAGR) ⓘ | N/A | 10.79% |
| DPS Growth (5Y CAGR) ⓘ | N/A | 9.41% |
Quality (Business durability) | ||
| ROIC (Latest) ⓘ | N/A | 10.75% |
| ROA (Latest) ⓘ | N/A | 5.41% |
| ROIC (5Y Median) ⓘ | N/A | 9.37% |
| ROA (5Y Median) ⓘ | N/A | 4.95% |
| Net Debt / EBIT (Latest) ⓘ | N/A | 2.04 |
| Net Debt / EBIT (5Y Median) ⓘ | N/A | 2.27 |
| Net Debt / EBITDA (Latest) ⓘ | N/A | 1.39 |
| Net Debt / Assets ⓘ | N/A | 19.27% |
| EBITDA / Interest ⓘ | N/A | 9.58 |
| Operating Margin (Latest) ⓘ | -30.48% | 10.49% |
| Operating Margin (5Y Median) ⓘ | N/A | 10.30% |
| Debt to Equity (Latest) ⓘ | N/A | 64.82% |
| Profit Margin (Latest) ⓘ | -66.67% | 6.67% |
| Free Cash Flow (Latest) ⓘ | $258.13M | |
Momentum (Price trend) | ||
| 3Y Return ⓘ | N/A | +67.77% |
| 12M Return (excl. last month) ⓘ | N/A | +12.05% |
| 6M Return ⓘ | N/A | 0.00% |
| Price vs. 200-Day MA ⓘ | N/A | +0.67% |
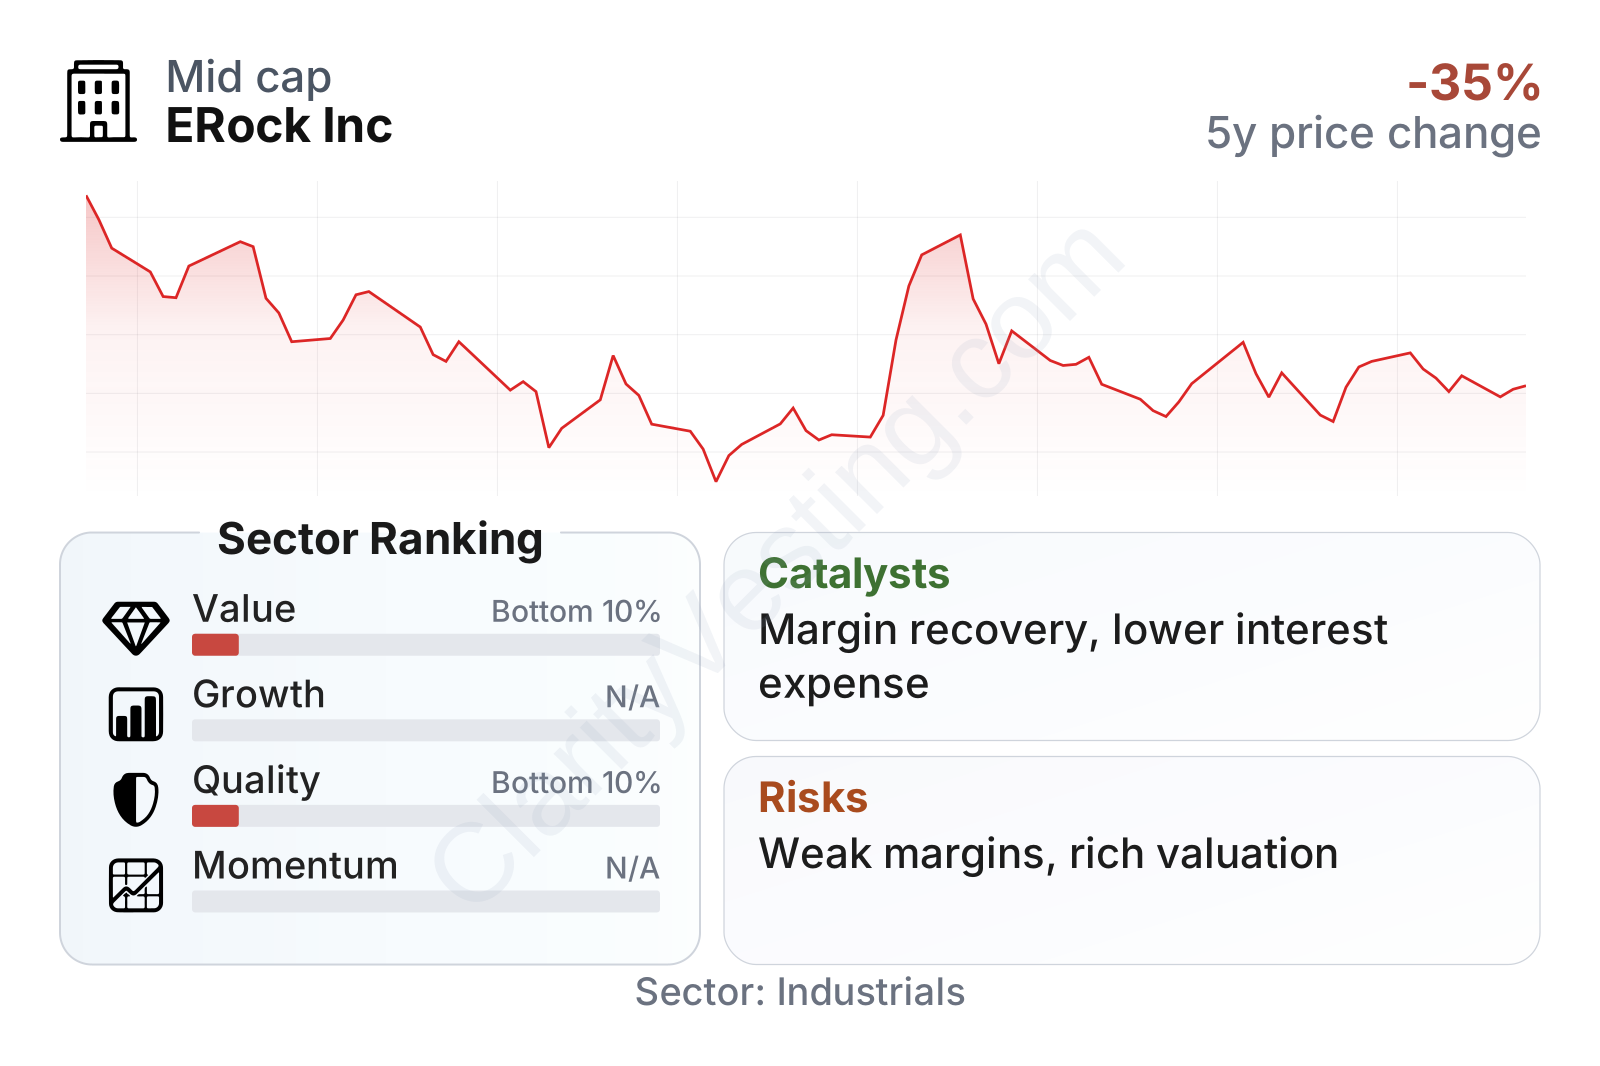
ERock is a small-to-mid-sized industrial company by market value, and the market’s recent view has become noticeably more cautious. The share price fell materially between June and September 2026, which usually signals concern about earnings quality, demand visibility, or valuation support.
The table points to a mixed financial profile. On one hand, free cash flow generation looks solid relative to the sector median, with free cash flow yield above the industry midpoint and free cash flow remaining positive in absolute terms. On the other hand, profitability metrics are weak: operating margin and profit margin are both deeply negative, placing quality measures near the bottom of the sector. Revenue growth is also under pressure on the latest year-over-year comparison, far below the sector median. Valuation multiples remain demanding despite those weaknesses, with both earnings and book-based ratios standing well above typical sector levels.
Growth
ERock’s end markets broadly sit in an attractive long-term area of the industrial economy. Electrification, grid-related investment, energy infrastructure renewal, and the need for more efficient industrial systems are all multi-year themes rather than one-off events. Companies exposed to those trends can benefit from utility upgrades, industrial modernization, and public or private infrastructure spending.
Strategically, ERock’s positioning appears sensible if management can convert demand into a stronger operating model. Revenue expanded from 2024 to 2025, and gross profit increased faster than sales in dollar terms, which can indicate better project mix, pricing, or improved execution. Another encouraging signal is the sharp reduction in interest expense between those two years, suggesting a less burdensome financing structure than before. If that lower interest load is sustained, it gives the company more room for future earnings recovery.
A potential catalyst is the gap between cash generation and accounting profitability. Positive free cash flow alongside negative reported earnings sometimes means the company has a path to better reported results if cost structure, working capital, or non-cash charges normalize. In other words, the business may be closer to financial stabilization than headline profit margins alone suggest.
Recent public company communications and filings should be watched for order intake, backlog development, margin recovery, and any updates on restructuring or integration efforts. For a company in this stage, those operating indicators matter more than short-term headline revenue alone because they help show whether growth is becoming more efficient.
Risks
This article is for informational purposes only and does not constitute financial advice. Some content is AI-generated. See Disclaimer


