Stock Analysis · EQT Corporation (EQT)
Overview
EQT Corporation is a large U.S. natural gas producer focused mainly on the Appalachian Basin, especially the Marcellus and Utica shale areas. In simple terms, the company drills wells, produces natural gas, natural gas liquids, and a smaller amount of oil, and then sells those commodities into U.S. energy markets. After its combination with Equitrans Midstream, EQT also has a stronger position in gathering, transmission, and water services tied to its production footprint. That matters because it gives the company more control over how gas moves from the wellhead to end markets.
For long-term analysis, the business is still primarily driven by commodity production, with natural gas clearly at the center. Based on recent company reporting, the main revenue sources can be summarized as follows:
- Natural gas sales: approximately 75% to 85% of total revenue in most periods. This is the core business and includes gas sold from EQT’s large Appalachian production base.
- Natural gas liquids sales: approximately 10% to 20%. This includes products such as ethane, propane, butane, and related liquids produced alongside natural gas.
- Oil and condensate sales: generally 0% to 5%. This is a much smaller contributor than gas.
- Midstream and related services: a smaller but increasingly relevant share after the Equitrans transaction, including gathering, transmission, storage, and water-related infrastructure activities.
- Risk management and other items: periodic gains or losses from hedging can materially affect reported revenue and earnings, even though they do not change the physical volumes produced.
EQT’s financial profile has been very cyclical in recent years, which is normal for an exploration and production company. Revenue and earnings have moved sharply with gas prices, but the broader trend shows a company that has become more efficient, more integrated, and less leveraged than it was earlier in the decade.
The long-term pattern is clear: results can swing dramatically from year to year, but the business has moved from losses in 2021 to much stronger profitability and cash generation more recently. The biggest driver remains commodity prices, while operating discipline and infrastructure control have become more important supports.
Key Figures
| Metric | Value | Sector ⓘ |
|---|---|---|
| Date | Oct 24, 2026 | |
| Context | ||
| Sector | Energy | |
| Industry | Oil & Gas E&P | |
| Market Cap ⓘ | $34.29B | |
| Beta ⓘ | 0.65 | |
Value (Cheapness) | ||
| P/E Ratio ⓘ | 12.72 | 15.40 |
| P/B Ratio ⓘ | 1.56 | 1.71 |
| FCF Yield ⓘ | 10.99% | 8.24% |
| Dividend Yield ⓘ | 1.20% | 3.52% |
| EBIT / EV ⓘ | 11.16% | 7.45% |
| PEG ⓘ | 1.49 | |
Growth (Business expansion) | ||
| Revenue Growth ⓘ | -3.90% | 26.85% |
| RPS Growth (5Y CAGR) ⓘ | -8.98% | 6.78% |
| EPS Growth (5Y CAGR) ⓘ | -3.43% | -14.41% |
| BVPS Growth (5Y CAGR) ⓘ | 1.20% | 6.08% |
| Margin Growth (5Y Trend) ⓘ | 54.76% | 0.55% |
| FCF Growth (5Y CAGR) ⓘ | 47.02% | 2.75% |
| DPS Growth (5Y CAGR) ⓘ | -0.25% | 16.79% |
Quality (Business durability) | ||
| ROIC (Latest) ⓘ | 10.41% | 11.30% |
| ROA (Latest) ⓘ | 6.90% | 6.00% |
| ROIC (5Y Median) ⓘ | 8.31% | 10.35% |
| ROA (5Y Median) ⓘ | 5.00% | 5.46% |
| Net Debt / EBIT (Latest) ⓘ | 1.32 | 1.64 |
| Net Debt / EBIT (5Y Median) ⓘ | 2.42 | 1.82 |
| Net Debt / EBITDA (Latest) ⓘ | 0.81 | 1.08 |
| Net Debt / Assets ⓘ | 13.41% | 17.29% |
| EBITDA / Interest ⓘ | 17.76 | 9.53 |
| Operating Margin (Latest) ⓘ | 45.07% | 16.21% |
| Operating Margin (5Y Median) ⓘ | 21.29% | 20.55% |
| Debt to Equity (Latest) ⓘ | 22.39% | 52.27% |
| Profit Margin (Latest) ⓘ | 29.18% | 8.79% |
| Free Cash Flow (Latest) ⓘ | $3.77B | |
Momentum (Price trend) | ||
| 3Y Return ⓘ | +33.18% | +68.93% |
| 12M Return (excl. last month) ⓘ | +3.11% | +42.90% |
| 6M Return ⓘ | -4.54% | +9.18% |
| Price vs. 200-Day MA ⓘ | -2.12% | +9.87% |
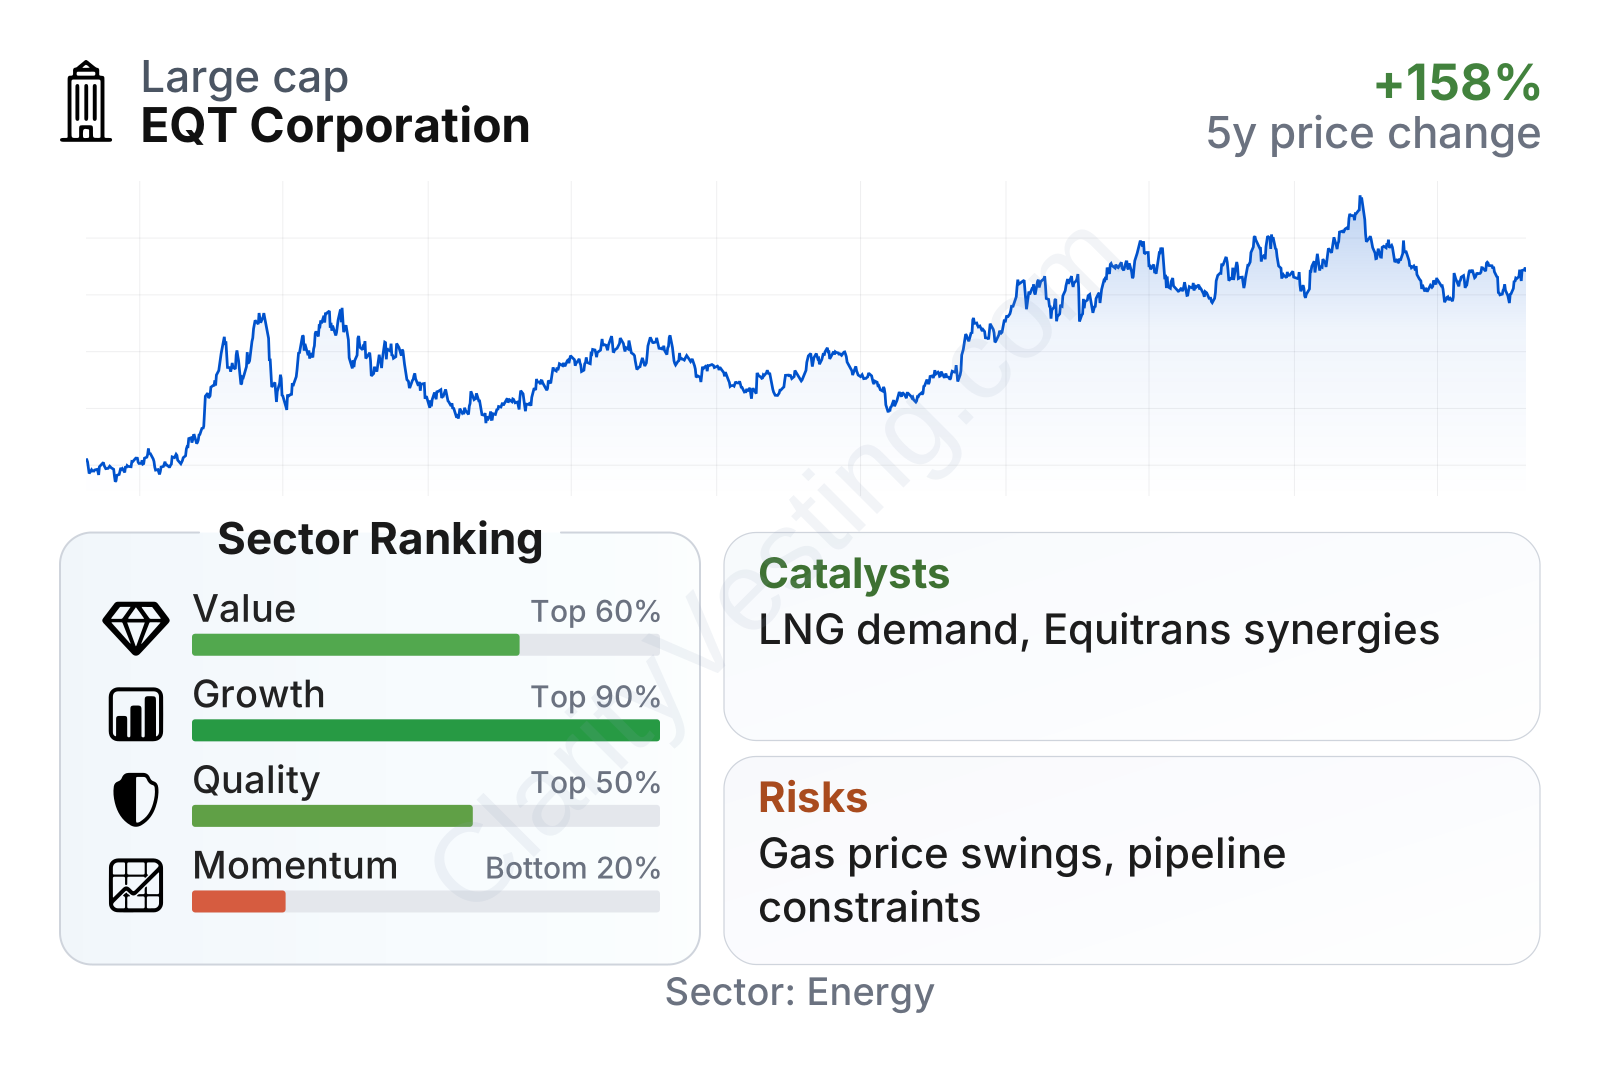
EQT is a large-cap energy company with lower share-price volatility than many peers, as shown by a beta well below 1. On valuation measures, the stock sits modestly below sector medians on earnings and book value multiples, while free cash flow yield looks stronger than the industry norm. The mixed picture is in growth and momentum: long-term cash flow and margin trends are strong, but recent revenue comparisons and stock performance have lagged the broader energy group. Quality is also uneven overall, with very good profitability and balance sheet metrics offset by returns on invested capital that do not clearly stand out versus the sector.
Growth
EQT operates in a part of the energy market that still has a meaningful long-term role. Natural gas is often treated as a transition fuel because it produces less carbon dioxide than coal in power generation, and it remains essential for electricity, industrial use, heating, and liquefied natural gas exports. In the United States, one of the strongest structural demand themes is rising LNG export capacity, which can pull more Appalachian gas toward Gulf Coast and international markets over time.
EQT’s strategy broadly makes sense for that backdrop. The company has emphasized scale, low-cost drilling, operational efficiency, and now tighter coordination between production and transportation infrastructure. That is especially relevant in Appalachia, where takeaway capacity has often been a bottleneck. Having stronger midstream exposure can improve reliability, reduce friction costs, and help the company place volumes into higher-value markets.
Revenue growth has been highly uneven, which is typical for a commodity producer. The company saw very strong growth during the energy price surge, then a deep contraction when gas prices weakened, followed by a recovery and another softer recent comparison. That volatility does not necessarily mean the operating base is deteriorating; it mainly shows how exposed reported sales are to natural gas pricing.
Cash generation is one of the more encouraging pieces of the EQT profile. Free cash flow has improved sharply from earlier periods and has reached a much stronger level recently. For a business like this, that matters more than headline revenue alone because it shows what remains after operating needs and capital spending. A producer that can still generate sizable cash in a weak pricing environment is in a better position to reduce debt, repurchase shares, maintain dividends, or fund selective expansion.
A major catalyst is the continued buildout of U.S. LNG demand and power demand. Data center growth, broader electrification, and gas-fired generation needs could support domestic natural gas consumption, while export demand may tighten the supply-demand balance. Another important catalyst is the integration of Equitrans assets, which can create cost savings, better field coordination, and stronger access to premium markets if execution remains solid.
Recent company communications have also highlighted a focus on operational improvements, synergy capture, and disciplined capital allocation. For a long-term view, that combination is more relevant than any single quarter’s commodity move.
Risks
This article is for informational purposes only and does not constitute financial advice. Some content is AI-generated. See Disclaimer


