Stock Analysis · EquipmentShare.com Inc (EQPT)
Overview
EquipmentShare.com Inc operates in the construction equipment rental and technology-enabled fleet management market. In simple terms, it rents machines such as aerial lifts, earthmoving equipment, and material handling tools to contractors, while also selling software and telematics tools that help customers track equipment, utilization, and jobsite activity. The company has expanded quickly by opening greenfield branches and making acquisitions, aiming to build a broad national rental network supported by its digital platform.
The business is largely driven by rental activity, with a smaller but strategically important contribution from technology and other related services. Based on the company’s recent annual reporting and segment disclosures, revenue is primarily generated from the following sources:
- Equipment rental and related rental services: approximately 75% to 85% of revenue. This includes owned fleet rentals, re-rent activity, delivery, damage waivers, and other branch-level rental services tied to construction and industrial jobsites.
- Equipment sales: approximately 10% to 20% of revenue. This generally includes the sale of used fleet equipment and, depending on the period, other equipment transactions that support fleet rotation and capital recycling.
- Technology and other services: less than 10% of revenue. This includes telematics, fleet management software, and related digital solutions marketed under the company’s technology offering.
What makes the company distinct is that it is not only trying to be a scale equipment renter, but also a connected-jobsite platform. That combination matters because traditional rental tends to be cyclical and capital-intensive, while software and telematics can deepen customer relationships, improve fleet utilization, and potentially support better pricing over time.
From 2022 through 2025, total revenue rose from about $1.7 billion to roughly $4.4 billion. Gross profit also increased materially over that span. However, net income remained thin because expansion costs, selling and administrative expenses, depreciation, and especially interest expense absorbed much of the operating gain. The pattern suggests a company still in buildout mode rather than one already optimized for mature profitability.
The revenue path has been strong, but the profit path has been much less linear. The business has scaled rapidly, yet financing costs and operating overhead have kept net earnings modest relative to sales. That tradeoff is central to understanding the long-term case.
Key Figures
| Metric | Value | Sector ⓘ |
|---|---|---|
| Date | Oct 24, 2026 | |
| Context | ||
| Sector | Industrials | |
| Industry | Rental & Leasing Services | |
| Market Cap ⓘ | $3.95B | |
| Beta ⓘ | N/A | |
Value (Cheapness) | ||
| P/E Ratio ⓘ | 141.82 | 22.29 |
| P/B Ratio ⓘ | 2.69 | 1.98 |
| FCF Yield ⓘ | -42.65% | 6.26% |
| Dividend Yield ⓘ | N/A | 1.92% |
| EBIT / EV ⓘ | 4.27% | 4.83% |
| PEG ⓘ | 1.19 | |
Growth (Business expansion) | ||
| Revenue Growth ⓘ | 26.30% | 9.30% |
| RPS Growth (5Y CAGR) ⓘ | 33.63% | 7.76% |
| EPS Growth (5Y CAGR) ⓘ | N/A | -13.17% |
| BVPS Growth (5Y CAGR) ⓘ | -24.38% | 6.13% |
| Margin Growth (5Y Trend) ⓘ | -3.10% | 0.74% |
| FCF Growth (5Y CAGR) ⓘ | N/A | 10.79% |
| DPS Growth (5Y CAGR) ⓘ | N/A | 9.41% |
Quality (Business durability) | ||
| ROIC (Latest) ⓘ | 5.29% | 10.75% |
| ROA (Latest) ⓘ | 0.93% | 5.41% |
| ROIC (5Y Median) ⓘ | N/A | 9.37% |
| ROA (5Y Median) ⓘ | N/A | 4.95% |
| Net Debt / EBIT (Latest) ⓘ | 11.67 | 2.04 |
| Net Debt / EBIT (5Y Median) ⓘ | 13.21 | 2.27 |
| Net Debt / EBITDA (Latest) ⓘ | 5.54 | 1.39 |
| Net Debt / Assets ⓘ | 61.40% | 19.27% |
| EBITDA / Interest ⓘ | 2.66 | 9.58 |
| Operating Margin (Latest) ⓘ | 7.55% | 10.49% |
| Operating Margin (5Y Median) ⓘ | 8.60% | 10.30% |
| Debt to Equity (Latest) ⓘ | 303.98% | 64.82% |
| Profit Margin (Latest) ⓘ | 0.51% | 6.67% |
| Free Cash Flow (Latest) ⓘ | -$1.69B | |
Momentum (Price trend) | ||
| 3Y Return ⓘ | N/A | +67.77% |
| 12M Return (excl. last month) ⓘ | N/A | +12.05% |
| 6M Return ⓘ | -28.08% | 0.00% |
| Price vs. 200-Day MA ⓘ | N/A | +0.67% |
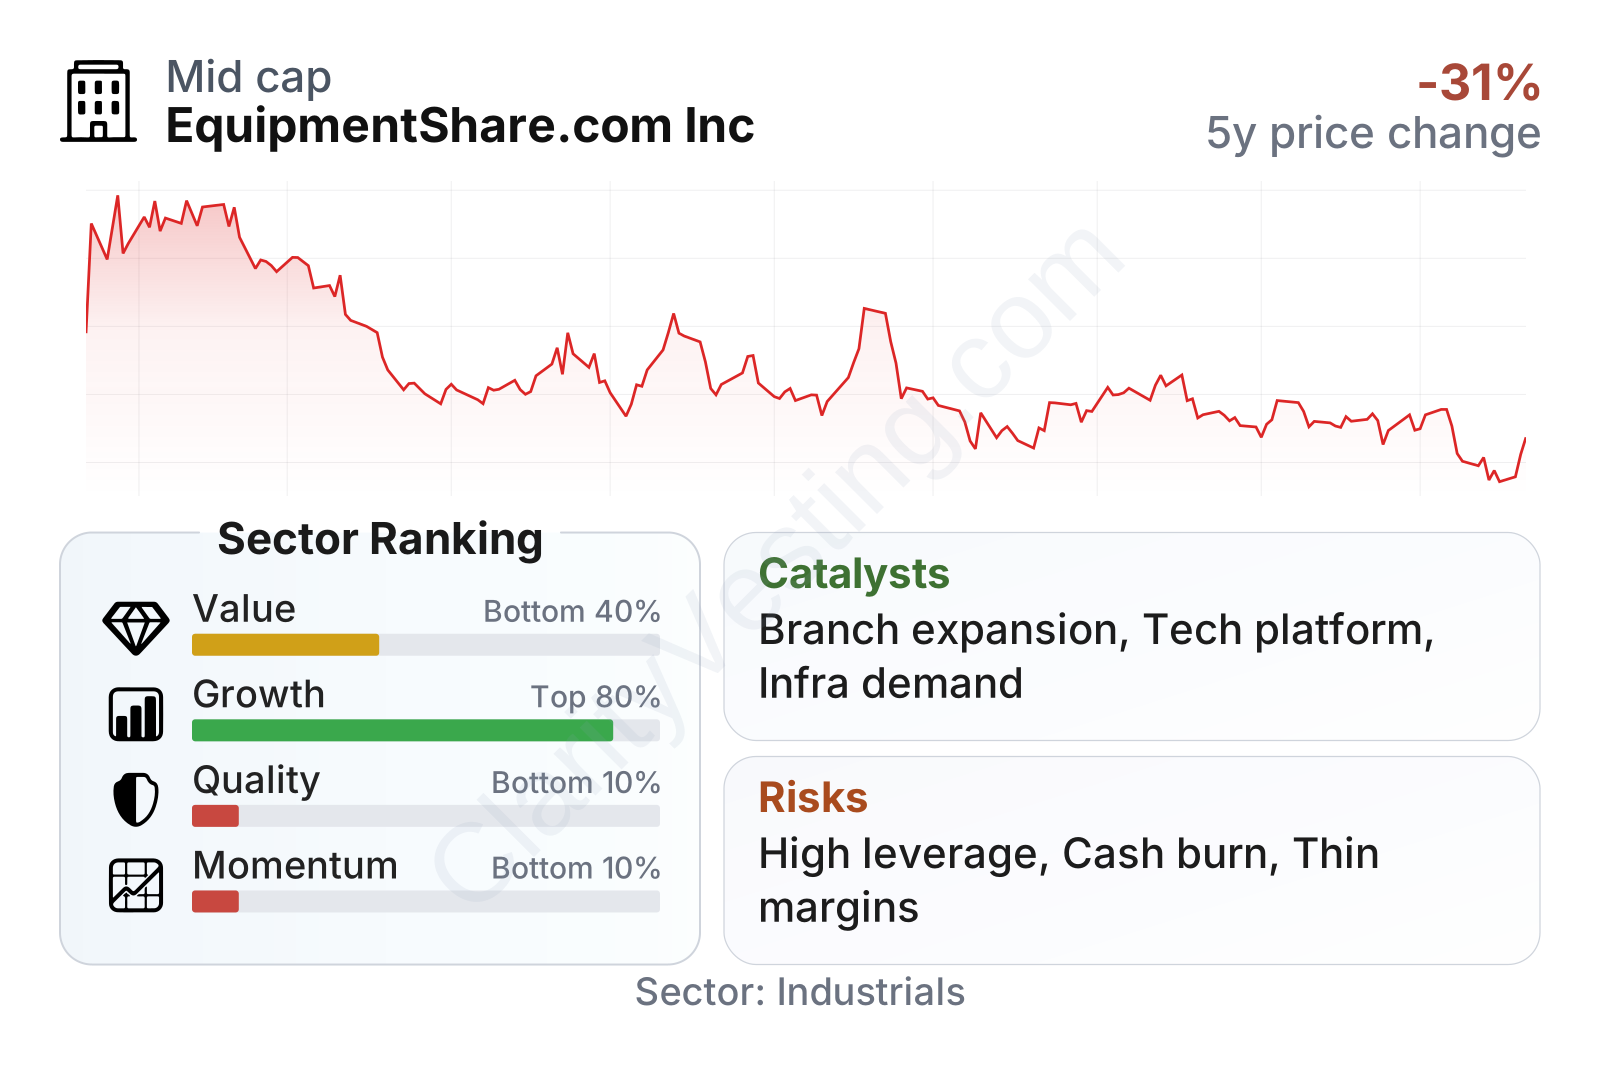
The metrics point to a mixed profile. Growth stands out, with revenue expansion clearly ahead of the sector median over both one-year and five-year views. By contrast, quality measures are weak: returns on assets and invested capital are low, leverage is high, and free cash flow is deeply negative. Valuation also looks demanding on earnings-based measures, although that needs to be viewed in the context of a business still carrying heavy expansion and financing costs. Recent share-price performance has also lagged much of the sector, showing that the market remains cautious despite the company’s top-line growth.
Growth
Equipment rental is tied to construction, infrastructure, industrial activity, and replacement demand, so it is not a defensive market, but it remains a large and structurally relevant one. Over time, many customers prefer renting rather than owning equipment because renting reduces upfront capital needs, avoids maintenance complexity, and gives flexibility when project demand changes. That broad industry trend supports long-run demand for national rental platforms.
EquipmentShare’s strategy is built around two growth engines. The first is physical expansion: adding locations, broadening fleet availability, and increasing density in local markets. The second is technology: using telematics and fleet software to improve customer workflows and potentially differentiate the rental offering from companies that mainly compete on fleet size and price. In principle, that strategy makes sense. A denser branch footprint can improve delivery times and fleet utilization, while software can strengthen retention and create more cross-selling opportunities.
The company has also benefited from a market backdrop that still favors infrastructure and non-residential construction activity in many regions of the United States. Public and private project pipelines can support equipment demand over multiple years, especially where labor shortages make equipment efficiency more important. If branch maturation continues and newly opened locations become more productive, revenue growth could begin to convert into stronger margins.
A notable catalyst is operating leverage. The company has already built a much larger revenue base, and if SG&A growth and interest expense become less burdensome relative to sales, earnings power could improve faster than revenue. Another potential catalyst is the technology segment: even if it remains small in revenue terms, it can help the company win and retain rental customers while giving the broader business a more differentiated identity than a pure-play local rental operator.
Recent company communications and public filings have continued to emphasize branch development, fleet investment, and technology integration rather than a shift away from expansion. That indicates management still sees a large addressable market and room to gain share, especially against fragmented regional competitors.
Risks
This article is for informational purposes only and does not constitute financial advice. Some content is AI-generated. See Disclaimer


