Stock Analysis · Equinor ASA (EQNR)
Overview
Equinor ASA is a large Norwegian energy company best known for producing oil and natural gas on the Norwegian continental shelf, while also expanding in offshore wind, carbon transport and storage, and other lower-carbon energy activities. The business is still centered on hydrocarbons, but management has been trying to use that cash generation to build a broader energy portfolio over time.
Its revenue base is spread across upstream production, trading and processing, and renewable power. Based on the company’s recent annual reporting structure, the main sources of revenue are approximately:
- Marketing, Midstream and Processing: roughly 50% to 60% of revenue. This includes trading, transportation, refining-related activities, gas processing, power and liquids marketing, and margins linked to moving energy from production to end markets.
- Exploration and Production Norway: roughly 25% to 35% of revenue. This is the core upstream business, mainly oil and gas production from the Norwegian continental shelf.
- International Exploration and Production: roughly 10% to 15% of revenue. This covers upstream fields outside Norway, including operations in the Americas and selected international markets.
- Renewables and low-carbon solutions: typically less than 5% of revenue. This includes offshore wind, power generation, and carbon management activities. The revenue share is still small, but the strategic role is larger than the current sales contribution.
One important point for long-term readers: revenue does not tell the whole economic story for Equinor. Trading and marketing can create very large sales volumes with lower margins, while Norwegian upstream production tends to contribute a disproportionate share of profit and cash flow. That means headline revenue mix can understate how dependent earnings remain on oil and gas prices, taxes, and field performance.
Over the last several years, the business has shown a classic commodity pattern: very strong revenue and profit during the 2022 energy spike, followed by normalization. Revenue stayed above $100 billion in both 2024 and 2025, but net income fell sharply from the 2022 peak as prices and margins came down. Costs have remained fairly controlled at the operating level, yet the profit stream remains heavily influenced by commodity prices and Norway’s high petroleum tax regime.
The business model remains highly cash generative even after the post-2022 cooling period, but it is clearly more cyclical than a typical industrial or consumer company. The most durable part of the franchise is not diversification by revenue line; it is the combination of large-scale offshore resource access, strong gas positioning in Europe, and a balance sheet that has historically remained manageable through the cycle.
Key Figures
| Metric | Value | Sector ⓘ |
|---|---|---|
| Date | Oct 17, 2026 | |
| Context | ||
| Sector | Energy | |
| Industry | Oil & Gas Integrated | |
| Market Cap ⓘ | $107.27B | |
| Beta ⓘ | -0.66 | |
Value (Cheapness) | ||
| P/E Ratio ⓘ | 12.37 | 15.44 |
| P/B Ratio ⓘ | 2.57 | 1.73 |
| FCF Yield ⓘ | 8.92% | 8.20% |
| Dividend Yield ⓘ | 3.47% | 3.59% |
| EBIT / EV ⓘ | 31.48% | 7.46% |
| PEG ⓘ | 1.12 | |
Growth (Business expansion) | ||
| Revenue Growth ⓘ | 37.40% | 26.90% |
| RPS Growth (5Y CAGR) ⓘ | 10.60% | 6.90% |
| EPS Growth (5Y CAGR) ⓘ | -21.94% | -15.73% |
| BVPS Growth (5Y CAGR) ⓘ | 6.66% | 6.07% |
| Margin Growth (5Y Trend) ⓘ | -11.41% | 0.58% |
| FCF Growth (5Y CAGR) ⓘ | -26.71% | 1.86% |
| DPS Growth (5Y CAGR) ⓘ | 35.14% | 16.79% |
Quality (Business durability) | ||
| ROIC (Latest) ⓘ | 13.50% | 11.40% |
| ROA (Latest) ⓘ | 6.54% | 6.06% |
| ROIC (5Y Median) ⓘ | 12.62% | 10.30% |
| ROA (5Y Median) ⓘ | 6.41% | 5.42% |
| Net Debt / EBIT (Latest) ⓘ | 0.70 | 1.64 |
| Net Debt / EBIT (5Y Median) ⓘ | 0.69 | 1.83 |
| Net Debt / EBITDA (Latest) ⓘ | 0.54 | 1.08 |
| Net Debt / Assets ⓘ | 17.29% | 17.29% |
| EBITDA / Interest ⓘ | 27.74 | 9.64 |
| Operating Margin (Latest) ⓘ | 30.66% | 16.27% |
| Operating Margin (5Y Median) ⓘ | 36.46% | 20.39% |
| Debt to Equity (Latest) ⓘ | 75.28% | 54.76% |
| Profit Margin (Latest) ⓘ | 7.97% | 8.82% |
| Free Cash Flow (Latest) ⓘ | $9.57B | |
Momentum (Price trend) | ||
| 3Y Return ⓘ | +69.25% | +67.38% |
| 12M Return (excl. last month) ⓘ | +92.62% | +49.19% |
| 6M Return ⓘ | +21.57% | +7.07% |
| Price vs. 200-Day MA ⓘ | +26.77% | +9.56% |
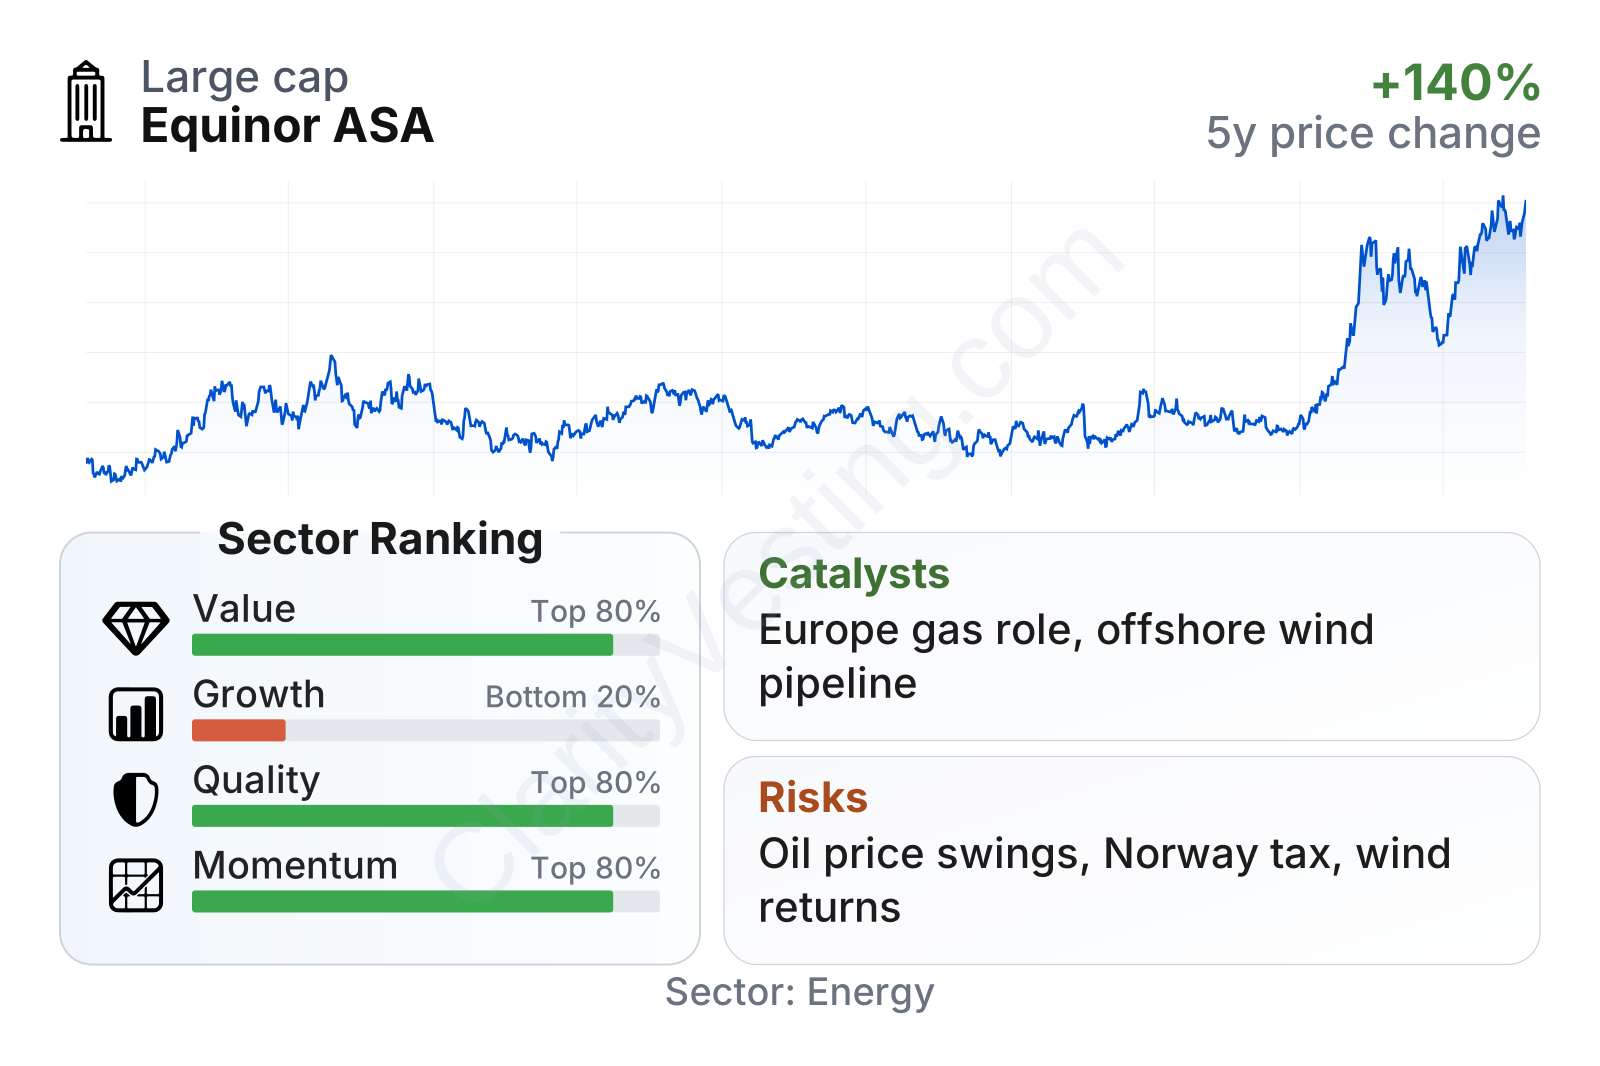
Equinor stands out as a very large integrated energy company with a market value above $100 billion, which gives it meaningful scale in project development, trading, and capital allocation. The stock’s recent performance has been strong versus much of the sector, and the company’s overall factor profile looks strongest in quality, value, and momentum, while growth is weaker because earnings and cash flow have come down from unusually high cycle peaks.
On valuation, the shares trade at a price-to-earnings ratio below the sector median, while free cash flow yield is slightly better than the sector median and EBIT relative to enterprise value is far stronger than average. On balance-sheet and operating quality, Equinor also compares well: returns on capital are above sector norms, interest coverage is very strong, and net debt relative to earnings is relatively low. The weak spot is that recent growth metrics are distorted by falling profits and cash flow since 2022, even though some revenue measures have improved again more recently.
Growth
Equinor operates in a sector with two different growth profiles at the same time. The traditional oil and gas business is mature, cyclical, and driven more by supply discipline, geopolitics, and pricing than by steady volume growth. By contrast, offshore wind, gas security, and carbon storage are areas with longer-term structural demand. Equinor’s strategy is to keep its high-margin hydrocarbon base strong enough to fund expansion in these newer segments.
That strategy makes industrial sense. Europe continues to place a high value on reliable natural gas supply, and Equinor is one of the continent’s most important external suppliers. Gas is likely to remain a strategic bridge fuel for years because it supports power systems when renewable output is variable. Equinor is therefore exposed to a part of the energy transition that can still generate meaningful cash, even if oil demand growth eventually slows.
Recent sales growth has been volatile rather than smooth. After the post-2022 drop, year-over-year revenue trends turned mixed, which is normal for a commodity-exposed company. The latest rebound is encouraging, but it should be read as part of a cyclical business rather than proof of a stable high-growth trajectory. Longer-term, the more relevant question is whether Equinor can keep production resilient, protect margins, and convert its legacy energy position into profitable lower-carbon assets.
Free cash flow tells the same story more clearly. The company generated exceptionally high cash during the energy shock, then saw a steep reset. Even so, it remains cash generative, and that matters because large offshore projects, shareholder distributions, and new energy investments all compete for capital. A lower but still positive cash flow base is healthier than a business that only works in boom years.
As for catalysts, three stand out. First, European gas demand for secure supply remains strategically important, which supports Equinor’s market position. Second, the company has a large pipeline of offshore wind and low-carbon projects that could gradually diversify earnings if execution improves. Third, portfolio optimization and project start-ups can lift production efficiency and cash generation without requiring major sector-wide demand acceleration.
Recent company updates have also highlighted continued project development in offshore wind and carbon management, as well as ongoing field activity on the Norwegian shelf. None of these items turns Equinor into a pure clean-energy growth company, but they do show a realistic path in which a traditional producer evolves into a broader energy platform rather than simply shrinking with the fossil fuel cycle.
Risks
This article is for informational purposes only and does not constitute financial advice. Some content is AI-generated. See Disclaimer


