Stock Analysis · Equity Bancshares Inc (EQBK)
Overview
Equity Bancshares is a regional bank based in the central United States. Through Equity Bank, it gathers deposits from individuals and businesses, makes loans, provides treasury and cash-management services, and earns fees from activities such as debit cards, mortgage banking, and wealth-related services. Its footprint has been built through a mix of local banking relationships and acquisitions, with a meaningful presence in Kansas, Oklahoma, Missouri, Arkansas, and nearby markets.
For a bank like Equity Bancshares, revenue does not look like revenue for an industrial or software company. The main engine is net interest income: the spread between what the bank earns on loans and securities and what it pays on deposits and other funding. A smaller but still important portion comes from fees and service income.
Based on recent annual reporting, the revenue mix appears to be approximately:
- Net interest income after provision for credit losses: about 80% to 85%. This is primarily loan interest income, partly offset by deposit costs and other funding costs.
- Non-interest income: about 15% to 20%. This includes service charges, card and interchange fees, mortgage banking, wealth or trust-related activities where available, and other banking service fees.
The broad trend in recent years has been a larger absolute revenue base, but with profitability moving around more than revenue because funding costs rose sharply across the banking industry. That matters for understanding the business: Equity Bancshares is not mainly a fast-changing technology company, but a spread-based lender whose earnings depend heavily on loan growth, deposit costs, credit quality, and interest-rate conditions.
The profit path over the last several years shows a volatile middle period rather than a straight line. Revenue expanded strongly from 2021 to 2024, while interest expense climbed much faster as deposit competition intensified. Profit recovered after the 2023 pressure point, but the pattern confirms that earnings are highly sensitive to the funding environment.
Key Figures
| Metric | Value | Sector ⓘ |
|---|---|---|
| Date | Oct 31, 2026 | |
| Context | ||
| Sector | Financial Services | |
| Industry | Banks - Regional | |
| Market Cap ⓘ | $1.01B | |
| Beta ⓘ | 0.81 | |
Value (Cheapness) | ||
| P/E Ratio ⓘ | 10.82 | 12.20 |
| P/B Ratio ⓘ | 1.25 | 1.26 |
| FCF Yield ⓘ | 4.59% | 9.87% |
| Dividend Yield ⓘ | 1.56% | 2.87% |
| EBIT / EV ⓘ | N/A | 8.17% |
| PEG ⓘ | 1.69 | |
Growth (Business expansion) | ||
| Revenue Growth ⓘ | 597.00% | 8.40% |
| RPS Growth (5Y CAGR) ⓘ | 7.61% | 12.31% |
| EPS Growth (5Y CAGR) ⓘ | 4.05% | -4.03% |
| BVPS Growth (5Y CAGR) ⓘ | 3.90% | 4.96% |
| Margin Growth (5Y Trend) ⓘ | -9.97% | -4.14% |
| FCF Growth (5Y CAGR) ⓘ | -20.95% | 4.70% |
| DPS Growth (5Y CAGR) ⓘ | 67.76% | 8.85% |
Quality (Business durability) | ||
| ROIC (Latest) ⓘ | N/A | 9.35% |
| ROE (Latest) ⓘ | 11.92% | 13.95% |
| ROA (Latest) ⓘ | 1.32% | 1.57% |
| ROIC (5Y Median) ⓘ | 7.55% | 7.78% |
| ROE (5Y Median) ⓘ | 11.56% | 12.12% |
| ROA (5Y Median) ⓘ | 1.14% | 1.28% |
| Net Debt / EBIT (Latest) ⓘ | N/A | 0.99 |
| Net Debt / EBIT (5Y Median) ⓘ | -0.90 | 0.73 |
| Net Debt / EBITDA (Latest) ⓘ | 1.18 | 0.79 |
| Operating Margin (Latest) ⓘ | N/A | 22.61% |
| Operating Margin (5Y Median) ⓘ | 24.52% | 24.52% |
| Debt to Equity (Latest) ⓘ | 65.20% | 58.76% |
| Profit Margin (Latest) ⓘ | 29.48% | 26.18% |
| Free Cash Flow (Latest) ⓘ | $46.49M | |
Momentum (Price trend) | ||
| 3Y Return ⓘ | +114.29% | +95.34% |
| 12M Return (excl. last month) ⓘ | +17.39% | +16.22% |
| 6M Return ⓘ | +9.32% | +7.41% |
| Price vs. 200-Day MA ⓘ | +4.54% | +5.48% |
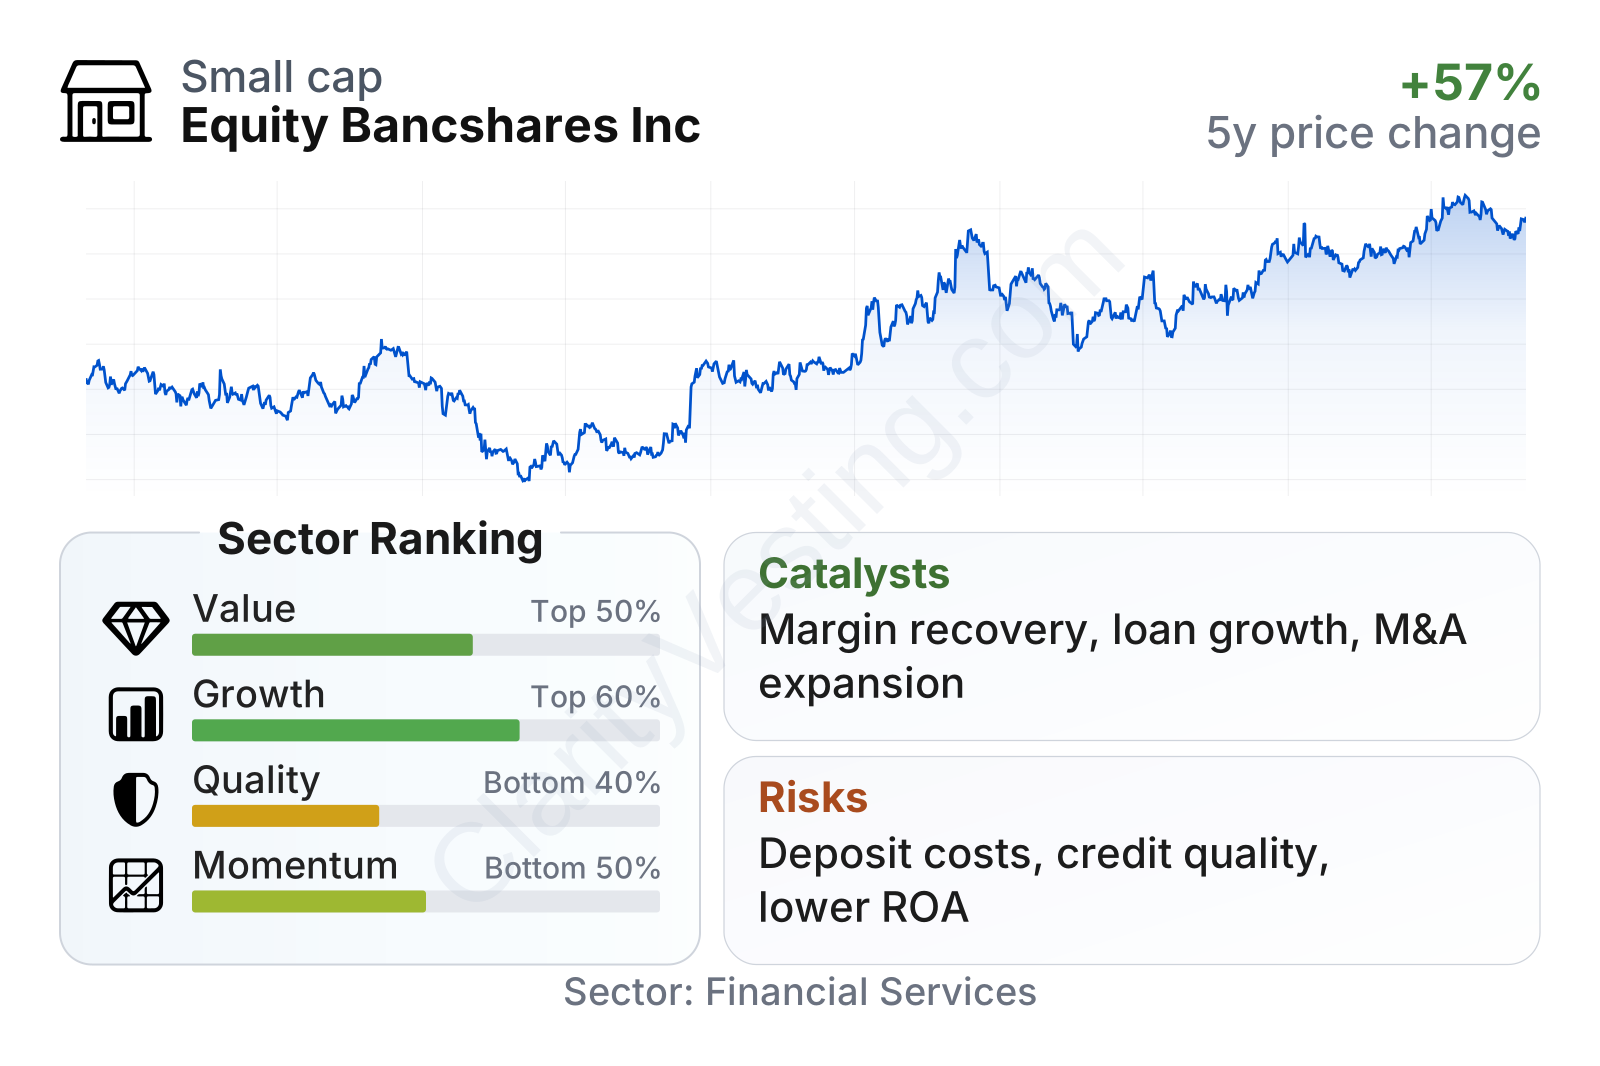
Equity Bancshares sits in the mid-range on valuation compared with regional banks, with earnings and book-value multiples close to sector norms. Growth metrics are mixed but generally respectable, especially on earnings over a five-year period and the rapid increase in the dividend per share. Quality measures are less impressive: profitability is positive and the profit margin is healthy, but return on equity and return on assets remain below the sector median. In short, the company looks like a profitable mid-sized regional bank with decent growth characteristics, but not one that clearly stands above peers on operating quality.
The stock-price history also reflects that profile. Shares fell hard during the 2023 regional banking stress, then recovered strongly into 2024 through 2026. That rebound suggests the market regained confidence in the bank’s earnings power and balance-sheet resilience, although it also means the easy recovery phase has largely already happened.
Growth
Equity Bancshares operates in a mature sector rather than a high-growth one. Regional banking typically grows through population and business expansion in local markets, share gains, acquisitions, and careful balance-sheet management. That makes the company’s geographic footprint important. Its markets in the central U.S. are generally tied to small and mid-sized businesses, commercial real estate, agriculture-related activity, and local consumer banking. These are steady demand areas, even if they rarely produce explosive growth.
The strategy makes sense for this type of institution. Management has historically emphasized community-bank scale with broader capabilities, which can help attract local businesses that want personal service but also need treasury, payments, and lending products. Acquisitions have also been part of the model, allowing the bank to expand deposits and loans without building every market from scratch.
Earnings per share show that growth has not been linear. Results softened from 2021 through 2023, rebounded strongly in 2024, and then stayed at a solid level. That pattern fits the broader industry backdrop: loan yields improved, but higher deposit costs and shifting balance-sheet dynamics created periodic pressure. Over five years, earnings growth remains positive and compares favorably with a sector where many peers saw flat or declining earnings.
Book value per share, a key measure for banks because it reflects the capital base behind the franchise, has improved meaningfully since the 2022 dip and reached a much higher level by 2024 and 2025. That recovery is important. It suggests that despite profit volatility, the bank rebuilt intrinsic balance-sheet value, which supports future lending capacity and provides a cushion in weaker periods.
A practical catalyst for future growth is any easing in deposit-cost pressure. If funding becomes cheaper or stabilizes while loan yields remain healthy, the bank’s margin can improve quickly. Another potential catalyst is continued loan growth in commercial and relationship-driven banking categories, especially if the company can deepen business customer ties rather than compete only on price. Additional branch or bank acquisitions could also matter, since consolidation remains common in regional banking.
Recent company updates have also pointed to continued dividend increases and ongoing operating execution, which signal confidence in capital generation. For a regional bank, that is not a dramatic catalyst by itself, but it does indicate that management sees earnings and capital levels as durable enough to support higher shareholder distributions over time.
Risks
This article is for informational purposes only and does not constitute financial advice. Some content is AI-generated. See Disclaimer


