Stock Analysis · EQT AB (EQBBF)
Overview
EQT AB is a global private markets investment firm. In simple terms, it raises money from institutions and wealthy clients, invests that capital into private companies, infrastructure projects, real estate, and venture opportunities, and then earns fees for managing those funds. It also earns performance-related income when investments are sold at gains or when portfolio values increase enough to trigger incentive fees.
The company operates across several private market strategies, with a business model built around long-duration capital. That matters for long-term analysis because recurring management fees tend to be more stable than transaction-based financial businesses, while carried interest and investment income can add upside in strong markets but also create earnings volatility.
Based on recent annual reporting, EQT’s revenue mix is mainly driven by fee-related earnings and performance-related income, with some variation from year to year depending on exits, fundraising, and valuation conditions. A practical breakdown is:
- Management and advisory fees: approximately 60% to 75% of revenue. These are recurring fees charged on assets under management across private equity, infrastructure, real estate, and private wealth vehicles.
- Performance fees and carried interest: approximately 15% to 30%. This comes from successful fund performance, realizations, and value creation in portfolio companies.
- Investment income and other revenue: approximately 5% to 15%. This includes balance-sheet investments and other smaller items tied to the firm’s platform.
EQT’s platform has become broader over time. It now combines traditional institutional fundraising with a stronger push into individual investor channels, especially through private wealth products and partnerships. That expands the addressable market beyond pension funds and sovereign investors.
The multiyear financial flow also shows a business that can be cyclical but highly profitable. Revenue and operating income rebounded strongly after a weak 2022–2023 period, and margins remained well above many peers in asset management.
Over the last several years, EQT’s revenue base has expanded materially, while profitability has swung with market conditions and performance-related income. The important takeaway is that the underlying earnings engine appears to have scaled up, even if annual results do not move in a straight line.
Key Figures
| Metric | Value | Sector ⓘ |
|---|---|---|
| Date | Oct 19, 2026 | |
| Context | ||
| Sector | Financial Services | |
| Industry | Asset Management | |
| Market Cap ⓘ | $37.30B | |
| Beta ⓘ | 1.40 | |
Value (Cheapness) | ||
| P/E Ratio ⓘ | 28.79 | 12.26 |
| P/B Ratio ⓘ | 0.47 | 1.23 |
| FCF Yield ⓘ | 3.08% | 10.40% |
| Dividend Yield ⓘ | 1.54% | 3.02% |
| EBIT / EV ⓘ | N/A | 8.14% |
| PEG ⓘ | 0.87 | |
Growth (Business expansion) | ||
| Revenue Growth ⓘ | 26.50% | 9.25% |
| RPS Growth (5Y CAGR) ⓘ | 8.18% | 12.19% |
| EPS Growth (5Y CAGR) ⓘ | 18.57% | -9.36% |
| BVPS Growth (5Y CAGR) ⓘ | 20.68% | 4.99% |
| Margin Growth (5Y Trend) ⓘ | -15.73% | -3.86% |
| FCF Growth (5Y CAGR) ⓘ | -11.08% | 4.81% |
| DPS Growth (5Y CAGR) ⓘ | 13.11% | 8.79% |
Quality (Business durability) | ||
| ROIC (Latest) ⓘ | N/A | 9.49% |
| ROE (Latest) ⓘ | 23.63% | 13.87% |
| ROA (Latest) ⓘ | 16.14% | 1.54% |
| ROIC (5Y Median) ⓘ | 8.48% | 7.86% |
| ROE (5Y Median) ⓘ | 9.51% | 12.17% |
| ROA (5Y Median) ⓘ | 6.50% | 1.30% |
| Net Debt / EBIT (Latest) ⓘ | 0.73 | 0.99 |
| Net Debt / EBIT (5Y Median) ⓘ | 1.59 | 0.73 |
| Net Debt / EBITDA (Latest) ⓘ | 0.54 | 0.91 |
| Operating Margin (Latest) ⓘ | 43.02% | 22.30% |
| Operating Margin (5Y Median) ⓘ | 39.78% | 24.63% |
| Debt to Equity (Latest) ⓘ | 33.99% | 58.04% |
| Profit Margin (Latest) ⓘ | 35.19% | 26.57% |
| Free Cash Flow (Latest) ⓘ | $1.15B | |
Momentum (Price trend) | ||
| 3Y Return ⓘ | +46.98% | +88.26% |
| 12M Return (excl. last month) ⓘ | -7.96% | +19.24% |
| 6M Return ⓘ | +8.72% | +4.70% |
| Price vs. 200-Day MA ⓘ | -6.25% | +3.66% |
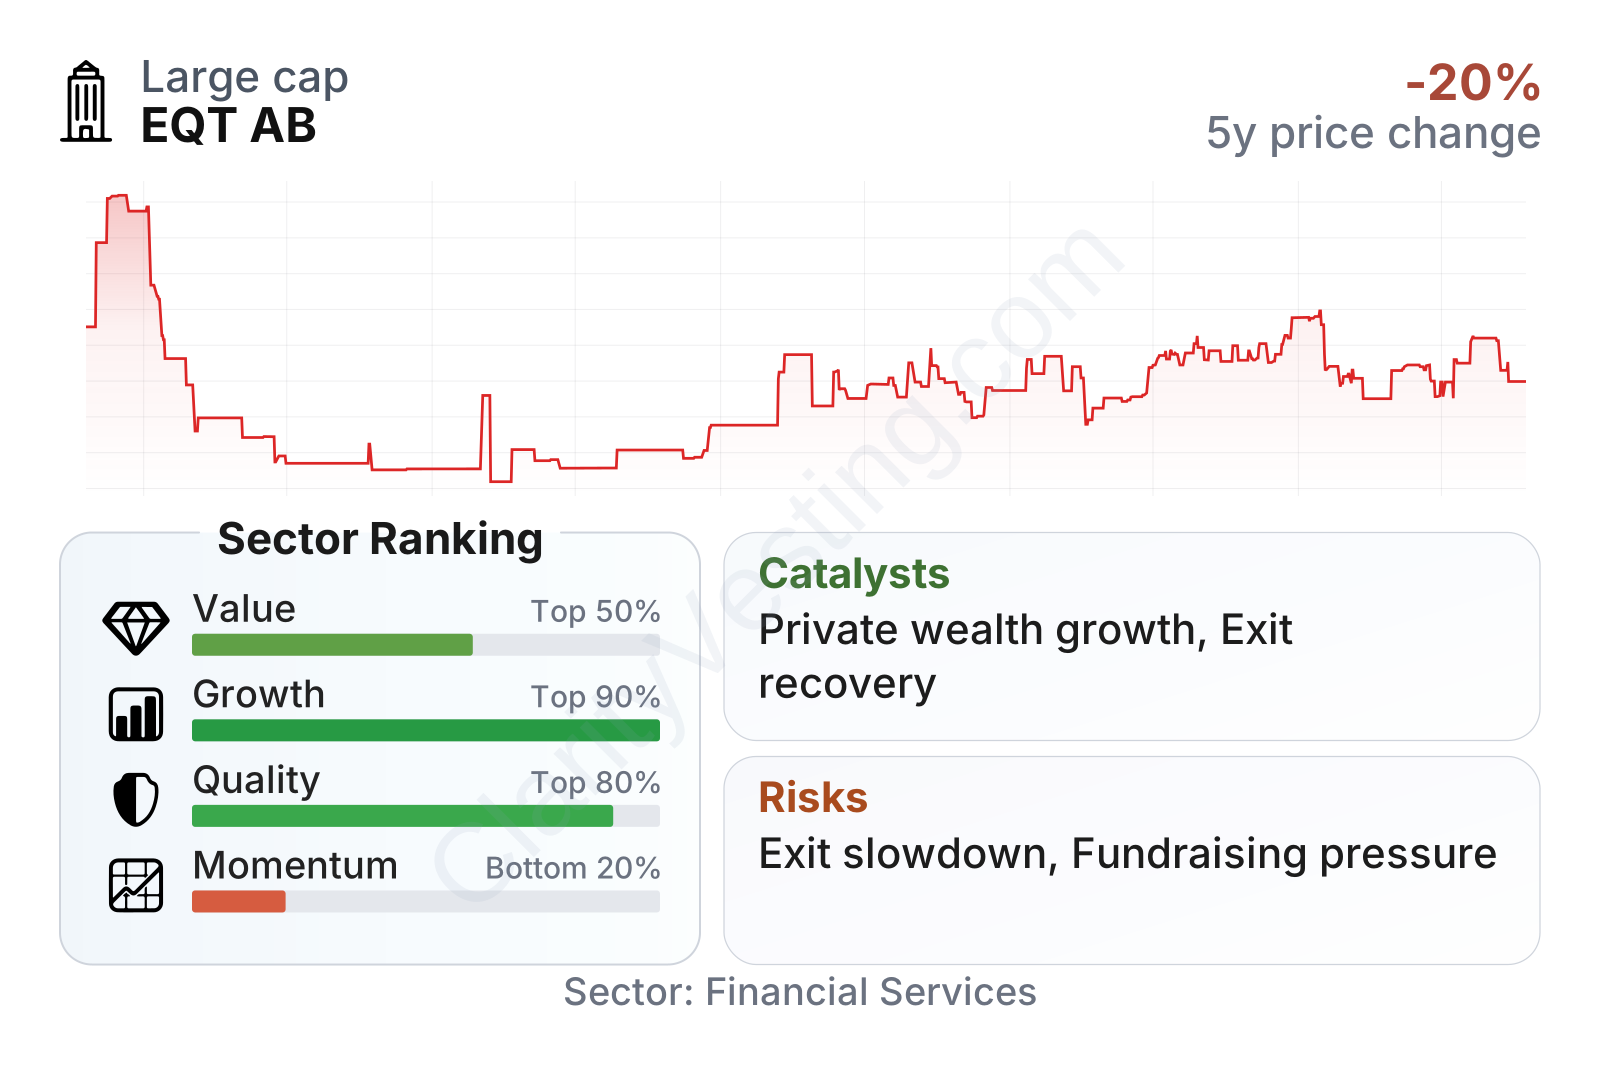
EQT is a large asset manager with above-average business quality metrics for its sector, but the stock’s recent market performance has been weaker than many financial peers. Profitability stands out: operating margin is around 43% and profit margin is around 35%, both comfortably above sector medians. Balance-sheet leverage also looks manageable, with debt-to-equity near 34% and net debt below annual EBITDA.
Growth metrics are strong overall, especially on earnings and book value over five years, although free cash flow and margin trends have been less consistent. On valuation, the picture is mixed. The earnings multiple is notably above the sector median, while the dividend yield and free-cash-flow yield are lower than typical sector levels. That usually suggests the market is placing a premium on future expansion rather than current cash return.
The share price history reflects this tension. EQT has recovered from the deep weakness of 2022, but the stock has remained volatile and has recently traded below its long-term moving average, showing that market confidence is not fully settled.
Growth
EQT operates in a part of finance that still has structural room to grow. Private markets have been taking share from public markets for years as large investors look for higher returns, specialized strategies, and access to assets that are not listed on exchanges. Areas such as infrastructure, energy transition, digital infrastructure, healthcare, software, and private credit all continue to attract capital globally.
EQT’s strategy is aligned with these trends. The firm has built a broad platform across private equity, infrastructure, real assets, and growth investing, and it has also expanded its private wealth reach. That matters because the wealth channel is one of the industry’s biggest opportunities: institutional investors already allocate heavily to private markets, while individual investor penetration remains much lower.
Another important growth driver is scale. In private markets, larger firms often gain advantages in fundraising, deal sourcing, operating resources, and product breadth. EQT’s global brand and large platform can help it win mandates from both institutions and wealth distribution partners. Once a manager reaches this level, growth can come not only from launching new funds, but also from adding adjacent strategies and raising larger vehicles over time.
Near-term earnings can still be uneven because performance income depends on realizations and market conditions. Even so, the longer-term pattern has been favorable: five-year EPS growth has been far stronger than the sector median. That suggests the company has created value through platform expansion and operating leverage, even if quarterly numbers remain lumpy.
Book value per share has also risen sharply over the past five years despite some year-to-year fluctuations. That is a useful signal for an alternative asset manager because it points to growing equity value and retained economic strength, not just temporary fee spikes.
A recent opportunity for EQT is the continued reopening of exit markets after a difficult period for private equity distributions. When deal activity and listings improve, firms like EQT can convert unrealized gains into performance-related earnings and recycle that success into new fundraising. Combined with ongoing demand for infrastructure and private wealth products, that creates a credible runway for continued expansion.
Risks
This article is for informational purposes only and does not constitute financial advice. Some content is AI-generated. See Disclaimer


