Stock Analysis · Essential Properties Realty Trust Inc (EPRT)
Overview
Essential Properties Realty Trust Inc is a real estate investment trust, or REIT. In simple terms, it buys properties and leases them to operating businesses, then collects rent. The company focuses mainly on single-tenant properties under long-term net leases. Under this structure, tenants usually pay property taxes, insurance, and maintenance costs, which makes rent income more predictable for the landlord.
EPRT is concentrated in sale-leaseback and relationship-driven transactions with middle-market tenants. In a sale-leaseback, a business sells its real estate to EPRT and then keeps using the property by signing a lease. This gives the tenant cash to run or expand its business, while EPRT gains a contractual stream of rental income.
The revenue base is dominated by rental income from a diversified property portfolio across service-oriented and experience-based industries. Based on company disclosures, revenue is primarily generated from contractual rents, with smaller contributions from tenant reimbursements, interest and other investment-related income, and occasional gains tied to property activity. The portfolio is intentionally spread across many tenants and industries so that no single tenant or business line defines the whole company.
At a high level, the main revenue sources are:
- Rental revenue from owned properties: roughly 95% to 98% of total revenue. This is the core business and comes from long-term lease payments on freestanding properties.
- Interest and other investment income: roughly 1% to 3%. This can include financing arrangements, direct loans, or other structured real estate investments.
- Other property-related income and gains: usually a small residual share, often below 2%, depending on asset sales, reimbursements, and timing effects.
EPRT’s tenant base is mostly exposed to businesses that are less vulnerable to e-commerce disruption than traditional store-based retail. Examples typically include restaurants, car washes, early childhood education, medical or health-related services, convenience-oriented uses, and entertainment concepts. That does not eliminate business risk, but it does make the portfolio different from mall or apparel-heavy retail landlords.
The business model is straightforward: raise capital, buy properties at yields above the cost of capital, lock in long leases with rent escalators, and grow cash flow through additional acquisitions. Over the last several years, the company has expanded revenue steadily while keeping operating margins high, which is typical of a scaled net-lease platform with disciplined overhead.
The overall earnings flow shows a business that has scaled meaningfully over time: revenue, operating income, and net income have all moved higher over the past several years. One point worth watching is that interest expense has also risen, which is normal for a growing REIT but makes financing conditions more important than they were earlier in the company’s expansion.
Key Figures
| Metric | Value | Sector ⓘ |
|---|---|---|
| Date | Oct 17, 2026 | |
| Context | ||
| Sector | Real Estate | |
| Industry | REIT - Retail | |
| Market Cap ⓘ | $5.56B | |
| Beta ⓘ | 0.84 | |
Value (Cheapness) | ||
| P/E Ratio ⓘ | 19.88 | 17.38 |
| P/B Ratio ⓘ | 1.28 | 0.85 |
| FCF Yield ⓘ | -2.53% | 7.38% |
| Dividend Yield ⓘ | 4.83% | 4.85% |
| EBIT / EV ⓘ | 4.57% | 3.78% |
| PEG ⓘ | N/A | |
Growth (Business expansion) | ||
| Revenue Growth ⓘ | 18.10% | 5.30% |
| RPS Growth (5Y CAGR) ⓘ | 9.20% | 6.02% |
| EPS Growth (5Y CAGR) ⓘ | -3.23% | -11.37% |
| BVPS Growth (5Y CAGR) ⓘ | 4.74% | 0.45% |
| Margin Growth (5Y Trend) ⓘ | 8.04% | -0.22% |
| FCF Growth (5Y CAGR) ⓘ | 22.83% | 5.40% |
| DPS Growth (5Y CAGR) ⓘ | 4.95% | 5.02% |
Quality (Business durability) | ||
| ROIC (Latest) ⓘ | 5.69% | 5.69% |
| ROE (Latest) ⓘ | 6.54% | 7.56% |
| ROA (Latest) ⓘ | 3.80% | 2.85% |
| ROIC (5Y Median) ⓘ | 5.46% | 4.22% |
| ROE (5Y Median) ⓘ | 6.22% | 6.03% |
| ROA (5Y Median) ⓘ | 3.84% | 2.44% |
| Net Debt / EBIT (Latest) ⓘ | 7.08 | 7.59 |
| Net Debt / EBIT (5Y Median) ⓘ | 7.38 | 8.40 |
| Net Debt / EBITDA (Latest) ⓘ | 4.95 | 5.27 |
| Net Debt / Assets ⓘ | 37.16% | 37.76% |
| EBITDA / Interest ⓘ | 4.39 | 4.10 |
| Operating Margin (Latest) ⓘ | 59.19% | 35.29% |
| Operating Margin (5Y Median) ⓘ | 62.90% | 37.31% |
| Debt to Equity (Latest) ⓘ | 66.19% | 88.87% |
| Profit Margin (Latest) ⓘ | 43.51% | 19.61% |
| Free Cash Flow (Latest) ⓘ | -$140.82M | |
Momentum (Price trend) | ||
| 3Y Return ⓘ | +35.98% | +30.75% |
| 12M Return (excl. last month) ⓘ | -2.52% | +4.36% |
| 6M Return ⓘ | -18.71% | -2.52% |
| Price vs. 200-Day MA ⓘ | -13.46% | -2.34% |
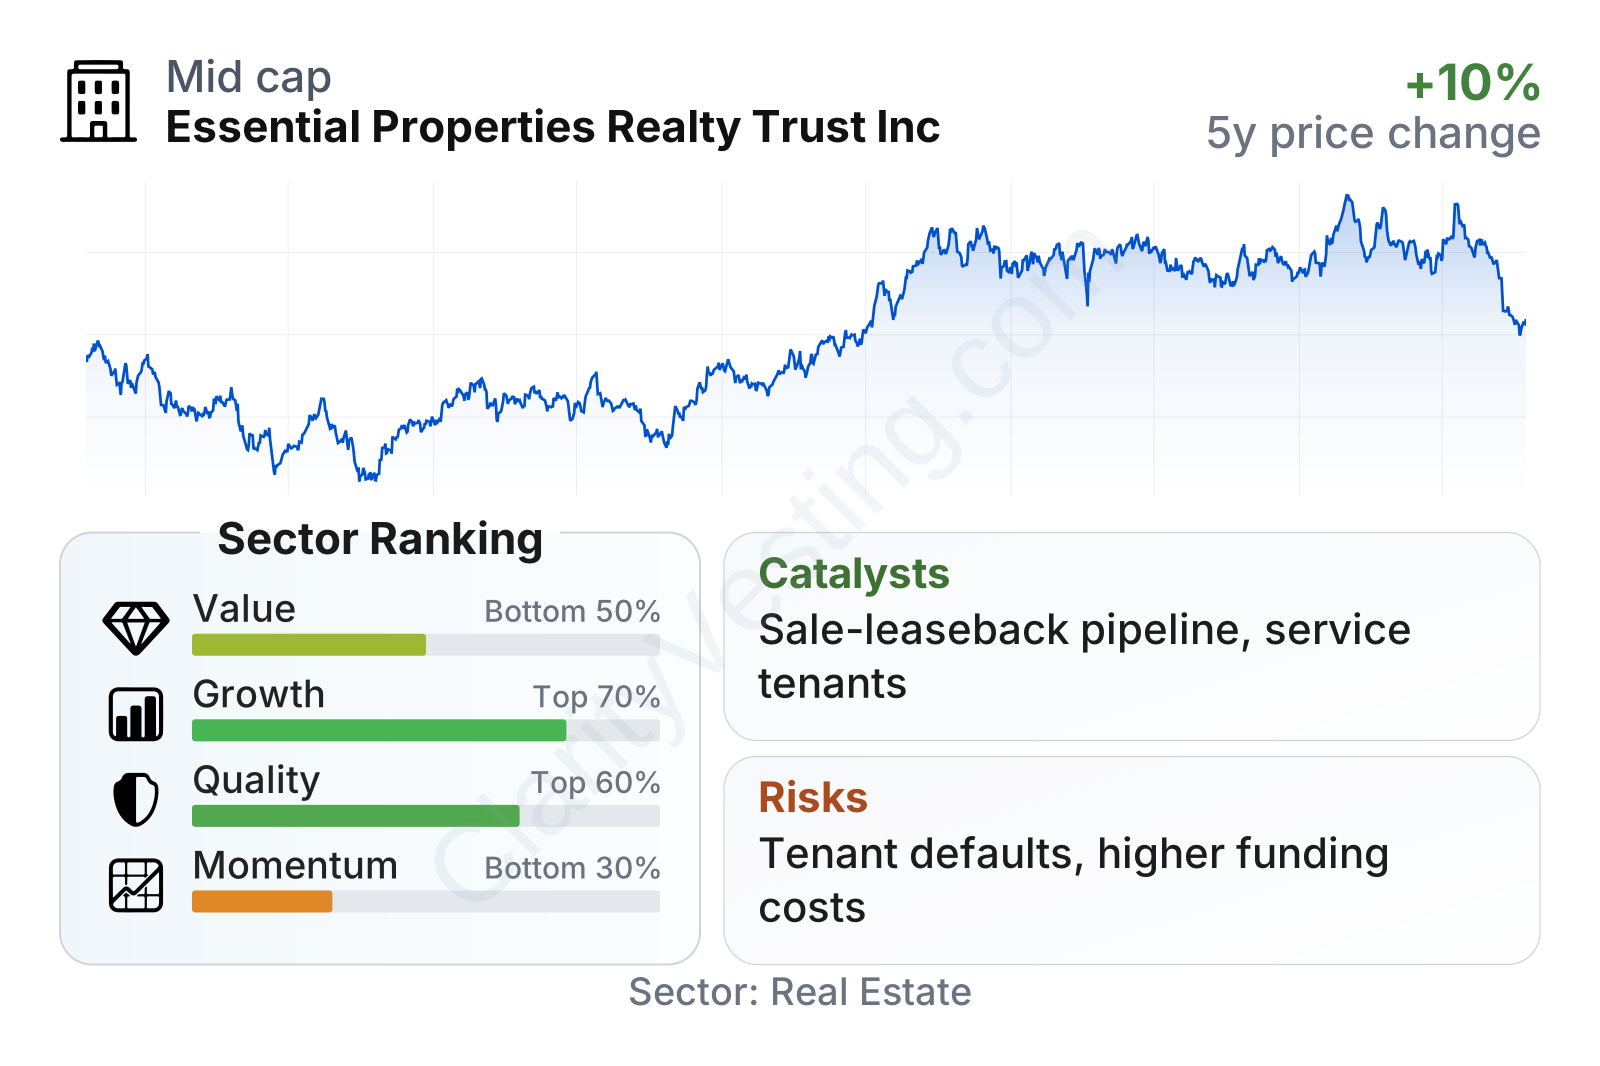
EPRT sits in the mid-cap range and has shown stronger growth and profitability than many peers, while valuation appears somewhat richer than the sector median on common balance-sheet measures. Quality metrics are generally solid for a REIT, with above-sector operating margin, profit margin, and asset returns. Growth stands out more clearly than momentum, as recent share-price performance has been softer even though business expansion remains healthy.
The stock’s recent path has been more uneven than its multi-year operating progress. Over a longer period, the share price has still advanced from the 2022 trough, but more recent performance suggests the market has become more cautious, likely reflecting interest-rate sensitivity and a less favorable backdrop for real estate multiples.
Growth
EPRT operates in a part of real estate that still has room to expand. Net-lease properties remain attractive to many operating businesses because sale-leasebacks can unlock capital without disrupting daily operations. That gives specialized landlords like EPRT a continuing pipeline of potential deals, especially among middle-market tenants that may not have broad access to cheap capital elsewhere.
The sector itself is not a high-growth corner of the market in the way software or semiconductors can be, but it can deliver durable expansion when acquisitions are disciplined and occupancy remains strong. EPRT’s strategy makes sense in that context. It focuses on properties tied to services, convenience, and local experiences rather than categories that are easier to replace online. That can support tenant demand and reduce exposure to some of the structural pressures facing traditional retail real estate.
Revenue per share has increased steadily over the last five years, which is an important sign for a REIT. It suggests growth has not come only from issuing more shares and buying more properties; on a per-share basis, the business has still moved forward. The five-year annualized growth rate is above the sector median, which supports the view that portfolio expansion has been productive rather than merely bigger.
Dividend per share has also trended higher, though at a measured pace. That pattern fits the profile of a company that is still balancing current distributions with the need to fund new investments. The current dividend yield is close to the sector median, but the more notable point is the consistency of the underlying increase over time.
A key catalyst for future growth is the company’s ability to keep sourcing accretive acquisitions in fragmented markets. Net-lease real estate remains highly fragmented, and EPRT does not need to dominate the entire market to keep growing. Another catalyst is the possibility that a more stable interest-rate environment could improve transaction economics, lower financing pressure, and support real estate valuations. If capital costs become easier to manage, EPRT’s acquisition engine could become more productive.
Recent company updates have continued to emphasize portfolio expansion, tenant diversification, and balance-sheet discipline. For a long-term view, that combination matters more than short-term price swings. The company’s operating trend points to a REIT still in expansion mode rather than one relying only on mature assets for income.
Risks
This article is for informational purposes only and does not constitute financial advice. Some content is AI-generated. See Disclaimer


