Stock Analysis · Enterprise Products Partners LP (EPD)
Overview
Enterprise Products Partners LP is one of the largest midstream energy companies in North America. In simple terms, it owns and operates the infrastructure that moves, stores, processes, and exports oil, natural gas, natural gas liquids, petrochemicals, and related products. Instead of primarily making money by drilling for oil or gas, Enterprise generally earns fees for providing transportation, storage, processing, fractionation, and terminal services. That business model tends to be steadier than commodity production because a large portion of cash flow is tied to volumes handled under contracts rather than direct exposure to daily oil and gas prices.
The company’s asset base is extensive and strategically located. It includes tens of thousands of miles of pipelines, natural gas processing plants, fractionators that separate mixed natural gas liquids into individual products, storage caverns, export terminals on the U.S. Gulf Coast, and petrochemical logistics assets. This broad network connects major producing basins, refining and petrochemical hubs, and international export markets, which gives Enterprise an important role in the U.S. energy value chain.
Based on the company’s segment reporting, the main sources of gross operating margin are spread across several lines rather than a single business. Approximate contributions can be summarized as follows:
- NGL Pipelines & Services: roughly 35% to 40%. This is typically the largest contributor and includes transporting, processing, fractionating, storing, and exporting natural gas liquids such as ethane, propane, and butane.
- Crude Oil Pipelines & Services: roughly 20% to 25%. This includes gathering, transporting, storing, terminaling, and exporting crude oil.
- Natural Gas Pipelines & Services: roughly 15% to 20%. This covers natural gas gathering, transportation, storage, and processing-related services.
- Petrochemical & Refined Products Services: roughly 15% to 20%. This segment handles products such as propylene and refined fuels through pipelines, terminals, and marine facilities.
That mix matters because it reduces dependence on any single product. Enterprise is tied not only to domestic energy demand, but also to exports of natural gas liquids, crude oil, and petrochemicals, which have become an increasingly important part of the U.S. energy system.
The company’s financial flow in recent years shows a familiar midstream pattern: very large revenue, high cost of goods sold because commodities often pass through the system, and a much more stable layer of operating income and net income underneath. Revenue has moved around with prices and volumes, but operating profit has remained comparatively resilient, which is more important for understanding the underlying business.
Key Figures
| Metric | Value | Sector ⓘ |
|---|---|---|
| Date | Oct 24, 2026 | |
| Context | ||
| Sector | Energy | |
| Industry | Oil & Gas Midstream | |
| Market Cap ⓘ | $79.86B | |
| Beta ⓘ | 0.48 | |
Value (Cheapness) | ||
| P/E Ratio ⓘ | 12.84 | 15.40 |
| P/B Ratio ⓘ | 2.72 | 1.71 |
| FCF Yield ⓘ | 4.33% | 8.24% |
| Dividend Yield ⓘ | 5.99% | 3.52% |
| EBIT / EV ⓘ | 6.76% | 7.45% |
| PEG ⓘ | 1.33 | |
Growth (Business expansion) | ||
| Revenue Growth ⓘ | 60.80% | 26.85% |
| RPS Growth (5Y CAGR) ⓘ | 6.73% | 6.78% |
| EPS Growth (5Y CAGR) ⓘ | -11.86% | -14.41% |
| BVPS Growth (5Y CAGR) ⓘ | 3.54% | 6.08% |
| Margin Growth (5Y Trend) ⓘ | -1.09% | 0.55% |
| FCF Growth (5Y CAGR) ⓘ | -17.14% | 2.75% |
| DPS Growth (5Y CAGR) ⓘ | 4.63% | 16.79% |
Quality (Business durability) | ||
| ROIC (Latest) ⓘ | 12.19% | 11.30% |
| ROA (Latest) ⓘ | 7.89% | 6.00% |
| ROIC (5Y Median) ⓘ | 12.43% | 10.35% |
| ROA (5Y Median) ⓘ | 7.95% | 5.46% |
| Net Debt / EBIT (Latest) ⓘ | 4.35 | 1.64 |
| Net Debt / EBIT (5Y Median) ⓘ | 4.28 | 1.82 |
| Net Debt / EBITDA (Latest) ⓘ | 3.25 | 1.08 |
| Net Debt / Assets ⓘ | 41.31% | 17.29% |
| EBITDA / Interest ⓘ | 6.91 | 9.53 |
| Operating Margin (Latest) ⓘ | 13.29% | 16.21% |
| Operating Margin (5Y Median) ⓘ | 13.88% | 20.55% |
| Debt to Equity (Latest) ⓘ | 112.47% | 52.27% |
| Profit Margin (Latest) ⓘ | 10.79% | 8.79% |
| Free Cash Flow (Latest) ⓘ | $3.46B | |
Momentum (Price trend) | ||
| 3Y Return ⓘ | +63.40% | +68.93% |
| 12M Return (excl. last month) ⓘ | +29.26% | +42.90% |
| 6M Return ⓘ | +1.24% | +9.18% |
| Price vs. 200-Day MA ⓘ | +0.29% | +9.87% |
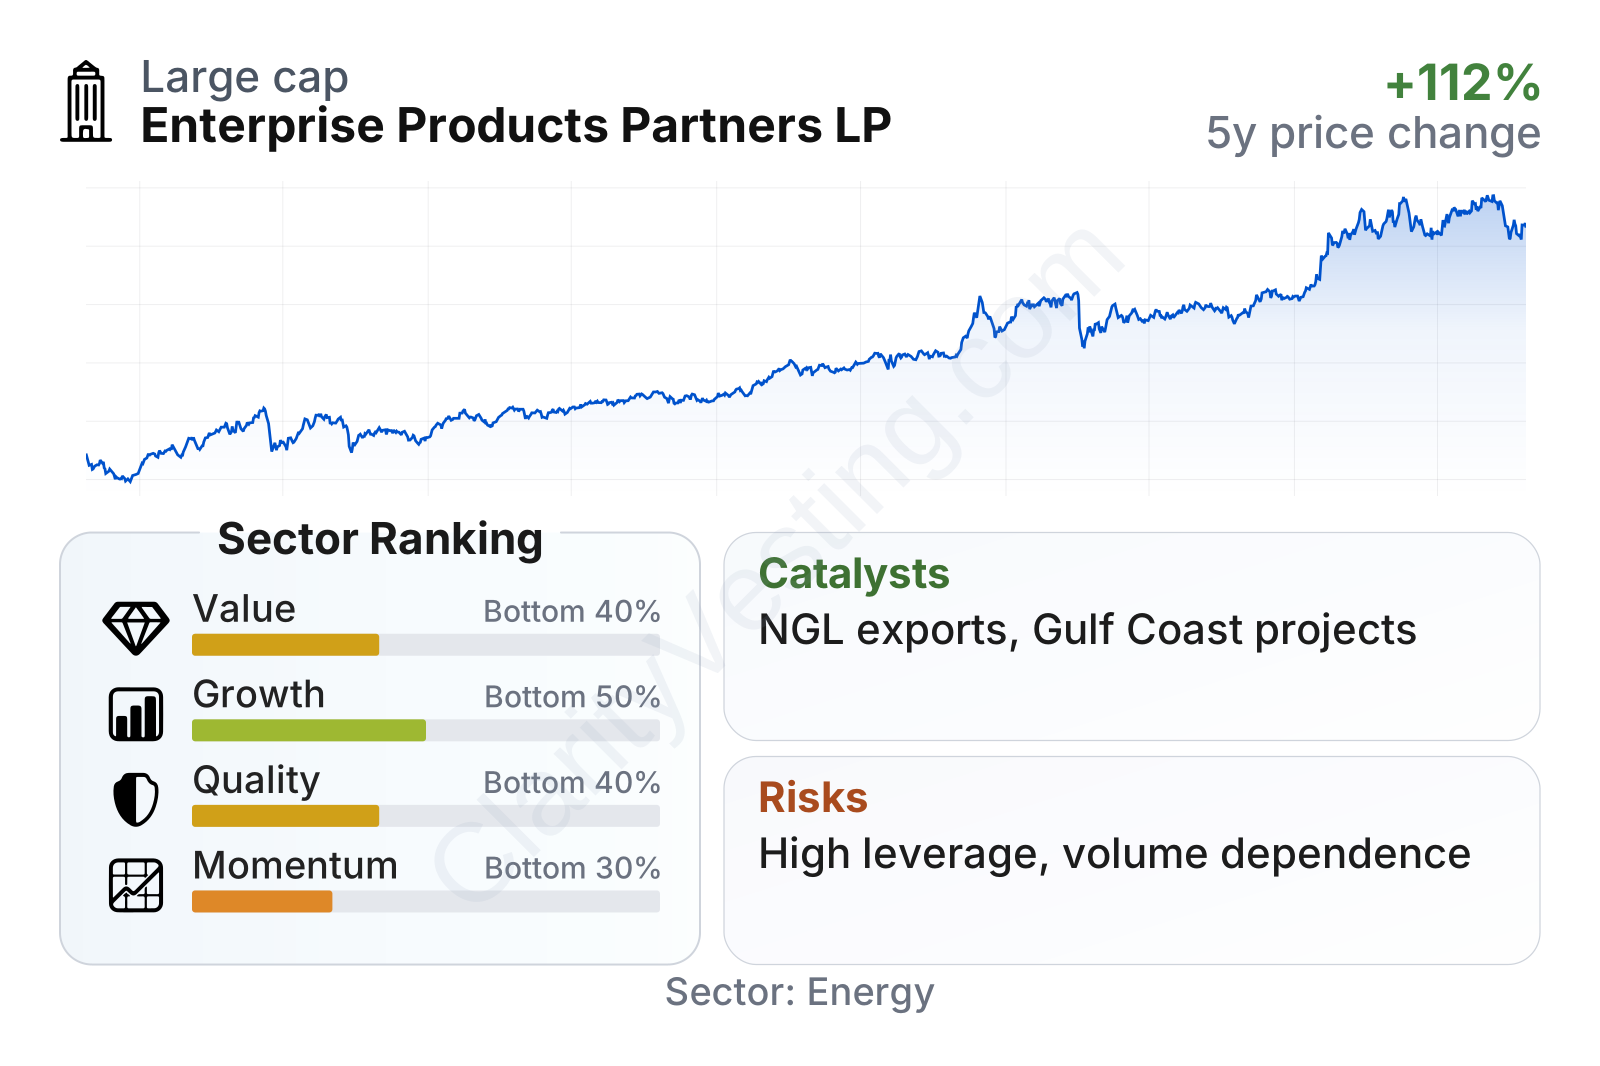
Enterprise is a very large energy infrastructure company with a low stock beta of about 0.48, meaning its share price has historically moved less than the broader market. Over the last several years, the stock price trend has been upward overall, although not in a straight line. The current factor profile looks mixed: profitability and returns on capital are solid, but growth and balance sheet leverage rank less favorably versus the wider energy sector. The cash distribution yield is noticeably above the sector median, while valuation is not especially cheap on enterprise-value-based measures.
Growth
Enterprise operates in a sector that still has meaningful long-term relevance, even though it is not a typical high-growth industry. Midstream infrastructure benefits when U.S. production volumes remain high, when petrochemical demand needs feedstocks such as ethane and propane, and when export markets continue pulling barrels and liquids from the Gulf Coast. In that sense, the company is positioned in a part of the energy market where demand is linked less to exploration risk and more to logistics, connectivity, and scale.
The company’s strategy for future expansion is coherent. Enterprise has consistently invested in projects that extend existing systems rather than making the business dependent on large, transformational acquisitions. That approach can be attractive in midstream because connecting new pipes, processing capacity, fractionation, or terminal assets into an existing footprint often carries lower execution risk than building entirely standalone systems. It also deepens customer relationships across multiple steps of the value chain.
Near-term revenue growth has been volatile, which is normal for this industry because reported sales can swing with commodity prices and product mix. The more recent rebound in year-over-year growth is notable, but it should be read carefully: for Enterprise, volume growth, margin stability, and cash generation are more informative than top-line revenue alone.
Free cash flow has moved lower over the last several years, dropping from well above $6 billion in earlier periods to around $2 billion to $4 billion more recently on a trailing basis. That does not automatically signal weakness, because midstream companies often go through cycles of heavier capital spending. Still, it does mean growth needs to be judged against how efficiently new projects turn into durable cash flow.
One of the clearest catalysts for Enterprise is the continued buildout of U.S. energy exports. The company has repeatedly emphasized opportunities tied to natural gas liquids, crude oil, petrochemicals, and marine terminal capacity along the Gulf Coast. As long as U.S. production remains competitive globally, companies with export-linked infrastructure can capture additional throughput and fee income. Another potential growth support is the company’s integrated system: when one customer uses multiple Enterprise assets across gathering, processing, transportation, storage, and export, the network becomes harder to replace.
Recent company updates have also pointed to a backlog of major organic projects scheduled to enter service over time. For a business like Enterprise, that matters because visible projects under construction provide a clearer line of sight to future volume growth than broad industry optimism alone.
Risks
This article is for informational purposes only and does not constitute financial advice. Some content is AI-generated. See Disclaimer


