Stock Analysis · Enerpac Tool Group Corp (EPAC)
Overview
Enerpac Tool Group Corp is an industrial equipment company that focuses on high-force tools and controlled lifting solutions. In simple terms, it sells specialized products used to lift, position, pull, push, tighten, cut, and move very heavy loads with precision. Its equipment is commonly used in infrastructure, manufacturing, oil and gas, marine, mining, power generation, and other maintenance-heavy industries where reliability and safety matter more than low price.
The company has become more focused over time. After reshaping its portfolio in recent years, Enerpac is centered mainly on industrial tools and related solutions rather than operating as a broad conglomerate. That makes the business easier to understand: it serves customers that need mission-critical hydraulic, mechanical, and automated force tools, plus services and accessories tied to that installed base.
Enerpac reports primarily through one core operating platform, with revenue coming from a mix of product categories and aftermarket activity rather than a large number of separate divisions. Based on company disclosures, the main sources of revenue can be summarized as follows:
- Industrial tools and services: approximately 100% of revenue. This includes high-pressure hydraulic tools, cylinders, pumps, torque and tension tools, lifting systems, gantries, jacks, heavy lifting technology, and related service work.
- Aftermarket, service, and accessories: a meaningful but not separately disclosed share of sales. This usually includes repairs, calibration, maintenance, spare parts, and consumables tied to the installed equipment base.
- Geographic mix: the company sells globally across the Americas, EMEA, and Asia-Pacific, which helps diversify end markets even though exact current-year percentages can vary by reporting period.
The financial profile has improved visibly over the last few years. Revenue has grown modestly, but the bigger shift has been profitability: gross profit has held up while operating expenses have become much leaner, allowing much more of each sales dollar to reach operating income and net income.
The business has become more efficient. Since fiscal 2022, revenue has moved from the low $570 million range to above $610 million, while operating income and net income have increased much faster. That suggests management has not relied only on volume growth; pricing, mix, and cost discipline have also played an important role.
Key Figures
| Metric | Value | Sector ⓘ |
|---|---|---|
| Date | Oct 03, 2026 | |
| Context | ||
| Sector | Industrials | |
| Industry | Specialty Industrial Machinery | |
| Market Cap ⓘ | $1.82B | |
| Beta ⓘ | 0.87 | |
Value (Cheapness) | ||
| P/E Ratio ⓘ | 19.96 | 22.45 |
| P/B Ratio ⓘ | 4.24 | 1.98 |
| FCF Yield ⓘ | 6.17% | 6.31% |
| Dividend Yield ⓘ | 0.11% | 1.96% |
| EBIT / EV ⓘ | 6.92% | 4.81% |
| PEG ⓘ | 0.34 | |
Growth (Business expansion) | ||
| Revenue Growth ⓘ | 5.60% | 9.10% |
| RPS Growth (5Y CAGR) ⓘ | 6.65% | 7.75% |
| EPS Growth (5Y CAGR) ⓘ | 12.93% | -13.59% |
| BVPS Growth (5Y CAGR) ⓘ | 3.92% | 6.22% |
| Margin Growth (5Y Trend) ⓘ | 11.86% | 0.72% |
| FCF Growth (5Y CAGR) ⓘ | 21.52% | 10.98% |
| DPS Growth (5Y CAGR) ⓘ | 0.09% | 9.48% |
Quality (Business durability) | ||
| ROIC (Latest) ⓘ | 16.37% | 10.92% |
| ROA (Latest) ⓘ | 11.38% | 5.41% |
| ROIC (5Y Median) ⓘ | 11.89% | 9.21% |
| ROA (5Y Median) ⓘ | 6.12% | 4.94% |
| Net Debt / EBIT (Latest) ⓘ | 0.52 | 2.07 |
| Net Debt / EBIT (5Y Median) ⓘ | 1.21 | 2.28 |
| Net Debt / EBITDA (Latest) ⓘ | 0.46 | 1.43 |
| Net Debt / Assets ⓘ | 8.52% | 19.27% |
| EBITDA / Interest ⓘ | 16.68 | 9.53 |
| Operating Margin (Latest) ⓘ | 20.85% | 10.50% |
| Operating Margin (5Y Median) ⓘ | 13.59% | 10.27% |
| Debt to Equity (Latest) ⓘ | 43.58% | 65.48% |
| Profit Margin (Latest) ⓘ | 14.72% | 6.62% |
| Free Cash Flow (Latest) ⓘ | $112.30M | |
Momentum (Price trend) | ||
| 3Y Return ⓘ | +32.46% | +58.56% |
| 12M Return (excl. last month) ⓘ | -11.77% | +15.63% |
| 6M Return ⓘ | -4.33% | +4.19% |
| Price vs. 200-Day MA ⓘ | -5.73% | +0.93% |
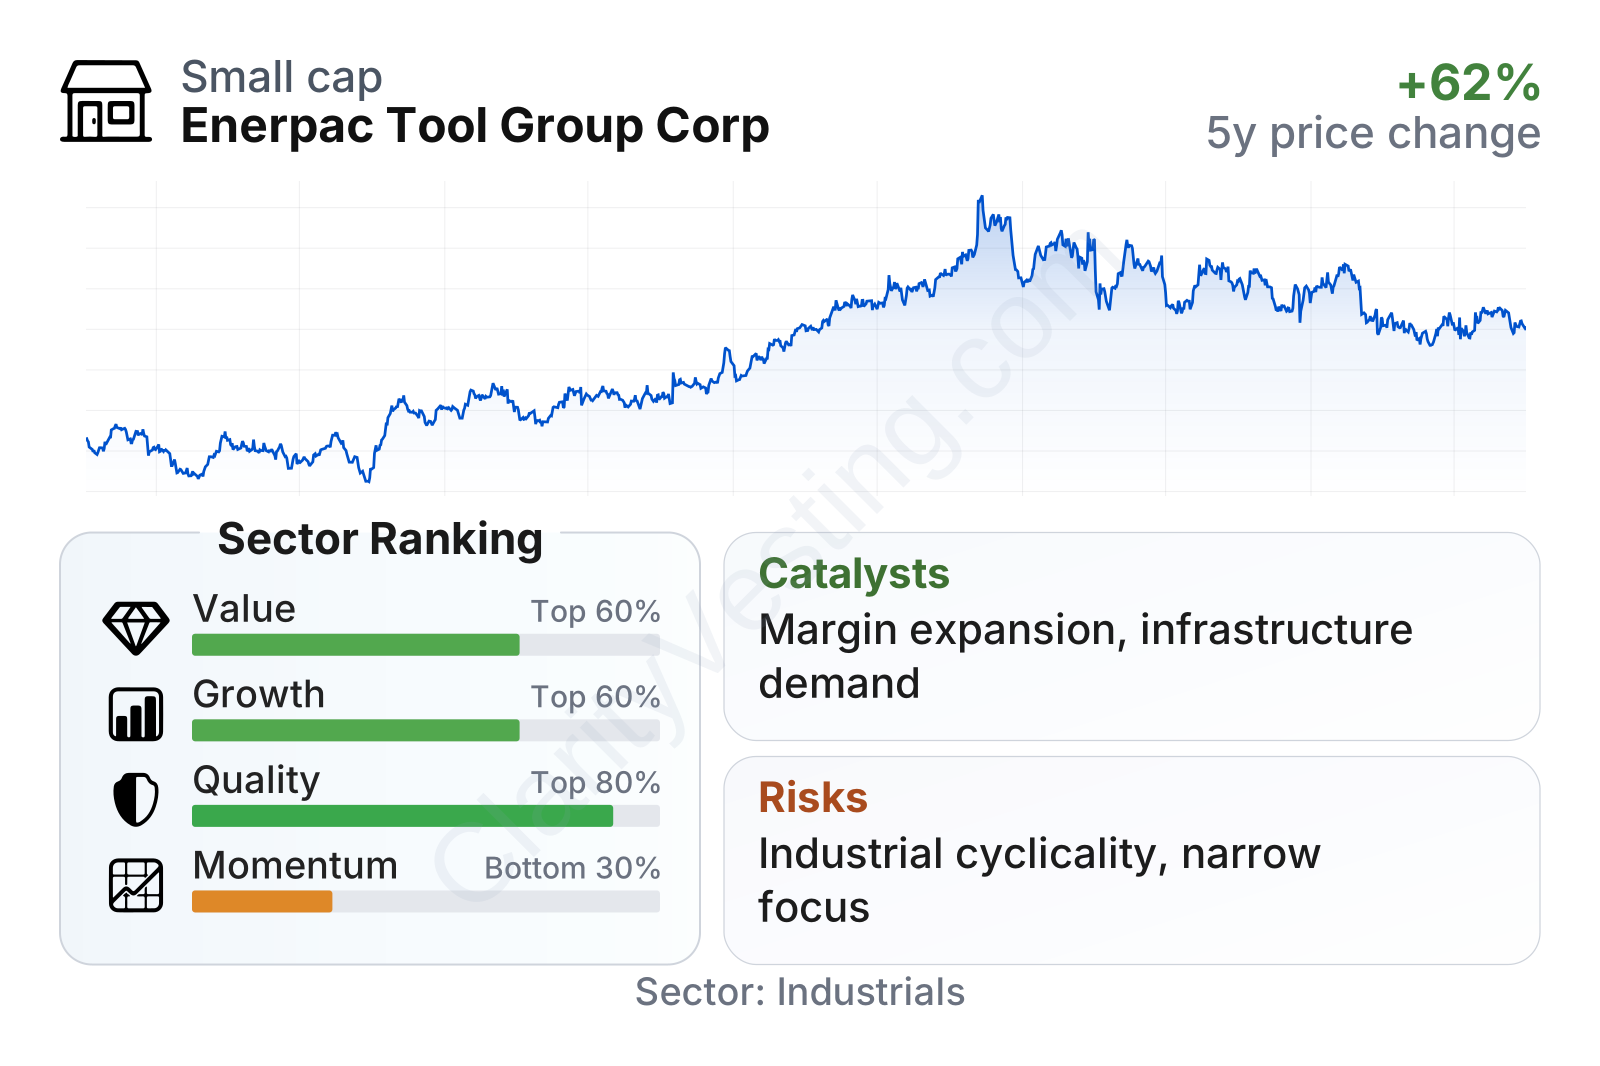
Enerpac is a mid-sized industrial company with a market value around $1.8 billion and a beta below 1, which points to share-price moves that have often been less volatile than the broader market. The quality profile stands out more than the growth or momentum profile. Profitability, returns on capital, and balance sheet leverage all compare well with many industrial peers, while recent share-price momentum has been weaker than the sector. On valuation measures, the stock trades near the sector median on earnings, but at a higher price-to-book multiple, which reflects the market giving credit to its improved margins and efficient capital use.
Growth
Enerpac operates in a part of the industrial market that is not usually described as fast-growing, but it can be durable and attractive. Heavy lifting, torque, and maintenance tools are needed in infrastructure work, industrial shutdowns, plant maintenance, utility projects, and large engineering jobs. These activities tend to persist across cycles, even if order timing can be uneven from quarter to quarter. Long-term support also comes from aging infrastructure, grid investment, energy transition projects, industrial automation, and the need for safer and more productive work practices.
The company’s strategy appears consistent with that backdrop. Management has emphasized higher-value niches where product performance, safety, and service matter a great deal. That is important because it gives Enerpac room to protect pricing better than a commodity tool supplier. The company has also been building around its core brand and installed base, which can support repeat sales from maintenance, parts, and service over time.
Revenue growth has not been perfectly smooth, but it has remained positive more often than negative. Recent year-over-year sales growth has generally been in the mid-single-digit range, which is below the sector median but still solid for a specialized industrial equipment supplier. More importantly, earnings have grown much faster than revenue over the last five years, showing that the business has been compounding through margin expansion as much as through top-line gains.
Cash generation is another encouraging point. Free cash flow has climbed strongly over the past several years and has recently moved above $100 million on a trailing basis. That matters because cash flow gives the company flexibility to reduce debt, support acquisitions, reinvest in product development, and return capital without stretching the balance sheet.
A notable catalyst is the company’s ability to keep expanding margins while adding selective acquisitions that strengthen its specialized tool lineup or geographic reach. Recent public company updates have also pointed to continued demand in infrastructure and industrial maintenance applications. In a business like this, even moderate sales growth can produce attractive earnings growth if mix and pricing stay favorable.
Risks
This article is for informational purposes only and does not constitute financial advice. Some content is AI-generated. See Disclaimer


