Stock Analysis · Eos Energy Enterprises Inc (EOSE)
Overview
Eos Energy Enterprises is a U.S. energy storage company focused on grid-scale battery systems. Its core product line is based on zinc-powered batteries designed for long-duration storage, meaning systems that can store electricity for several hours and discharge it when power is needed later. The company mainly serves utilities, independent power producers, renewable energy developers, and commercial or industrial customers that want to balance electricity supply, support the grid, or improve resilience.
The business is much more concentrated than a diversified industrial company. Based on recent company filings, revenue is overwhelmingly tied to battery system sales and related project activity, while service and other revenue remain relatively small.
- Battery energy storage systems and project revenue: approximately more than 90% of revenue. This includes the sale, delivery, and installation-related activity tied to Eos storage systems for customer projects.
- Service, support, and other revenue: approximately less than 10% of revenue. This can include maintenance, commissioning, and other support elements attached to deployed systems.
The broad financial pattern has been unusual but important to understand: revenue stayed very small for several years while manufacturing costs remained far above sales, then began ramping much faster more recently. That suggests Eos is still moving from an early commercialization phase toward larger-scale execution rather than operating as a mature, stable equipment supplier.
The long-term pattern shows a business that only recently started generating meaningful top-line scale. Revenue rose sharply in 2025 after several years of very limited sales, but costs still exceeded revenue by a wide margin, showing that manufacturing efficiency and operating discipline remain central to the investment case.
Key Figures
| Metric | Value | Sector ⓘ |
|---|---|---|
| Date | Oct 17, 2026 | |
| Context | ||
| Sector | Industrials | |
| Industry | Electrical Equipment & Parts | |
| Market Cap ⓘ | $1.13B | |
| Beta ⓘ | 2.88 | |
Value (Cheapness) | ||
| P/E Ratio ⓘ | N/A | 22.10 |
| P/B Ratio ⓘ | N/A | 1.97 |
| FCF Yield ⓘ | -37.27% | 6.38% |
| Dividend Yield ⓘ | N/A | 1.94% |
| EBIT / EV ⓘ | -7.96% | 4.79% |
| PEG ⓘ | N/A | |
Growth (Business expansion) | ||
| Revenue Growth ⓘ | 351.40% | 9.30% |
| RPS Growth (5Y CAGR) ⓘ | 49.65% | 7.81% |
| EPS Growth (5Y CAGR) ⓘ | N/A | -13.06% |
| BVPS Growth (5Y CAGR) ⓘ | N/A | 6.14% |
| Margin Growth (5Y Trend) ⓘ | N/A | 0.88% |
| FCF Growth (5Y CAGR) ⓘ | N/A | 11.01% |
| DPS Growth (5Y CAGR) ⓘ | N/A | 9.48% |
Quality (Business durability) | ||
| ROIC (Latest) ⓘ | N/A | 10.84% |
| ROA (Latest) ⓘ | -85.62% | 5.41% |
| ROIC (5Y Median) ⓘ | -167.00% | 9.38% |
| ROA (5Y Median) ⓘ | -166.55% | 4.95% |
| Net Debt / EBIT (Latest) ⓘ | N/A | 2.08 |
| Net Debt / EBIT (5Y Median) ⓘ | N/A | 2.27 |
| Net Debt / EBITDA (Latest) ⓘ | N/A | 1.39 |
| Net Debt / Assets ⓘ | 32.17% | 19.28% |
| EBITDA / Interest ⓘ | N/A | 9.58 |
| Operating Margin (Latest) ⓘ | -60.81% | 10.50% |
| Operating Margin (5Y Median) ⓘ | -1064.12% | 10.29% |
| Debt to Equity (Latest) ⓘ | -201.80% | 65.48% |
| Profit Margin (Latest) ⓘ | -246.76% | 6.67% |
| Free Cash Flow (Latest) ⓘ | -$420.76M | |
Momentum (Price trend) | ||
| 3Y Return ⓘ | +49.76% | +61.68% |
| 12M Return (excl. last month) ⓘ | -46.19% | +12.58% |
| 6M Return ⓘ | -30.80% | 0.00% |
| Price vs. 200-Day MA ⓘ | -57.16% | +0.02% |
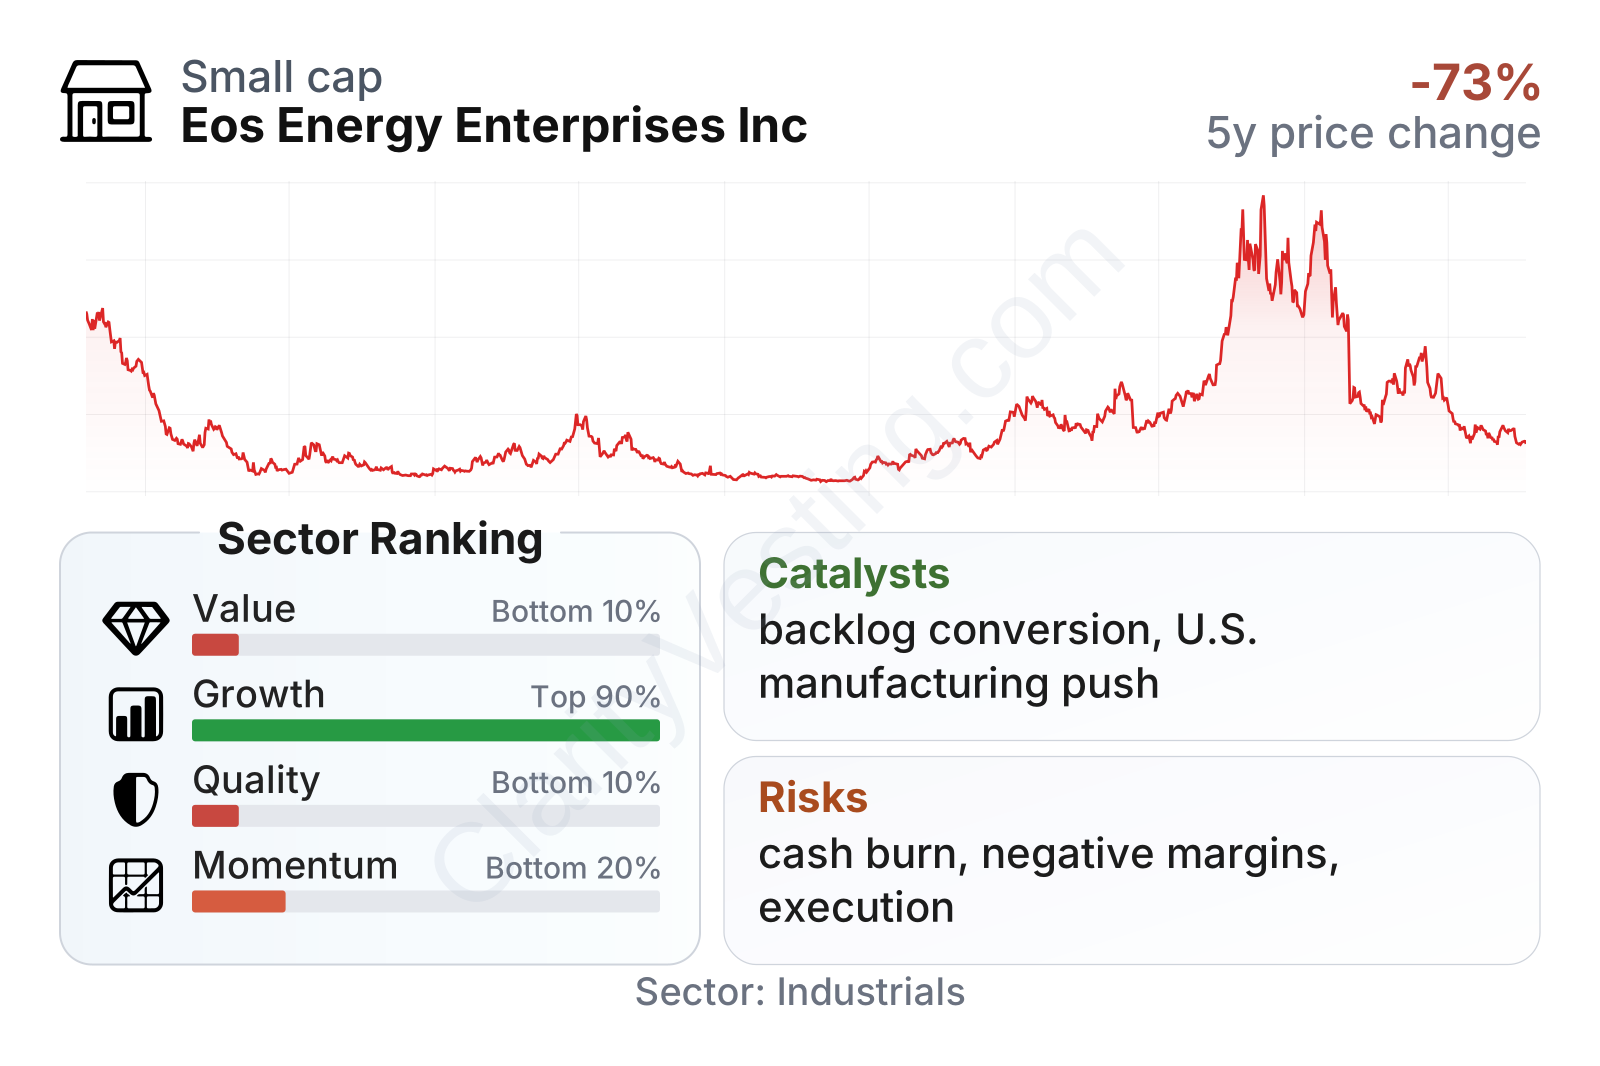
Eos stands out for very strong growth metrics relative to its industrial peers, but the rest of the profile is much weaker. Profitability, returns on assets, and cash generation remain far below sector norms, while share-price behavior has been highly volatile. In simple terms, the market is valuing Eos more like a scaling technology manufacturer than a proven industrial operator, so growth is visible, but financial quality is still fragile.
The stock-price history also reflects that tension. After collapsing from its 2021 levels, the shares rebounded sharply into late 2025 and early 2026 before falling back again. That kind of move usually signals a company whose future depends heavily on execution milestones, financing confidence, and the pace of order conversion rather than on steady earnings.
Growth
Eos operates in a sector with clear structural support. Grid operators and utilities need more storage as solar and wind capacity grows, power markets become more volatile, and electricity systems require backup capacity and flexibility. Long-duration storage is an especially important niche because many lithium-ion systems are optimized for shorter discharge periods. Eos is trying to position its zinc-based chemistry as an alternative for customers who want domestically manufactured systems, reduced reliance on critical minerals associated with lithium supply chains, and potentially safer stationary storage.
The company’s strategy is logically aligned with those industry needs. Recent filings and company updates have emphasized expanding manufacturing capacity, building a larger backlog, and using government-supported financing tools to accelerate production. Eos has also highlighted a U.S.-based manufacturing model, which matters more as domestic content rules and energy-security concerns influence procurement decisions.
Revenue growth has been extremely uneven, which is common in project-based industrial businesses at this stage, but the latest trend is clearly stronger than the company’s earlier years. Recent year-over-year growth rates have been far above the sector median, indicating that customer adoption is no longer purely theoretical. The main question is no longer whether demand exists, but whether Eos can fulfill that demand efficiently and profitably.
A major growth catalyst is the potential conversion of backlog into delivered projects at better unit economics. Public company materials have pointed to a large order pipeline and the need to ramp output meaningfully. If production volumes rise enough, Eos could benefit from operating leverage, where fixed costs are spread across more units. Another meaningful catalyst is policy support for domestic energy infrastructure, including the broader U.S. push for local battery supply chains and grid modernization.
At the same time, free cash flow remains deeply negative and has worsened recently, which shows growth is still consuming substantial capital. That does not invalidate the expansion case, but it means progress must eventually show up not only in revenue, but also in cash burn, gross margin, and delivery consistency.
Risks
This article is for informational purposes only and does not constitute financial advice. Some content is AI-generated. See Disclaimer


