Stock Analysis · Electro Optic Systems Holdings Limited (EOPSF)
Overview
Electro Optic Systems Holdings Limited is an Australian defense and space technology company. Its business is centered on systems that help military customers detect threats, protect vehicles, and operate weapons remotely, as well as optical communications equipment for space applications. In simple terms, the company sells high-value hardware and integrated systems used in defense programs, and it also develops technology for satellite and space communications.
The group has historically reported two main operating areas: defense systems and space systems. Defense is the larger activity and includes remote weapon stations, counter-drone and surveillance technologies, vehicle integration, and related support. Space includes laser-based communication terminals and other equipment aimed at satellites and space infrastructure. Public company materials indicate that defense remains the dominant revenue source, while space is smaller but strategically important because it targets a potentially fast-growing market.
Based on recent company reporting, revenue is mainly generated from the following sources:
- Defense Systems: approximately 75% to 90% of revenue in recent years. This includes remote weapon systems, vehicle turrets, fire control products, border and site protection solutions, and sustainment or integration services tied to defense contracts.
- Space Systems: approximately 10% to 25% of revenue in recent years. This activity includes optical communications terminals, satellite communications payload-related work, and other space technology programs.
- Support, integration, and other activities: a smaller contribution embedded within the segments above, depending on contract mix and project timing.
The business model is therefore contract-driven rather than subscription-based. Revenue can move sharply from one period to another depending on when large defense orders are signed, manufactured, delivered, and accepted by customers.
The company’s financial flow over the last several years shows a volatile pattern: revenue recovered after a weak 2022, gross profitability improved in 2023 and 2024, but operating costs remained heavy enough to keep profitability under pressure. That combination is common in smaller defense technology companies that are trying to scale manufacturing, fund product development, and win larger long-cycle programs at the same time.
A notable pattern is that gross profit improved meaningfully after 2022, suggesting better product mix or execution, but operating expenses and financing costs have still weighed on earnings. That makes order quality, delivery discipline, and cost control especially important for the next phase.
Key Figures
| Metric | Value | Sector ⓘ |
|---|---|---|
| Date | Oct 03, 2026 | |
| Context | ||
| Sector | Industrials | |
| Industry | Aerospace & Defense | |
| Market Cap ⓘ | $1.64B | |
| Beta ⓘ | 2.22 | |
Value (Cheapness) | ||
| P/E Ratio ⓘ | N/A | 22.45 |
| P/B Ratio ⓘ | 3.68 | 1.98 |
| FCF Yield ⓘ | -5.19% | 6.31% |
| Dividend Yield ⓘ | N/A | 1.96% |
| EBIT / EV ⓘ | N/A | 4.81% |
| PEG ⓘ | N/A | |
Growth (Business expansion) | ||
| Revenue Growth ⓘ | 283.00% | 9.10% |
| RPS Growth (5Y CAGR) ⓘ | -17.59% | 7.75% |
| EPS Growth (5Y CAGR) ⓘ | -20.35% | -13.59% |
| BVPS Growth (5Y CAGR) ⓘ | -12.88% | 6.22% |
| Margin Growth (5Y Trend) ⓘ | N/A | 0.72% |
| FCF Growth (5Y CAGR) ⓘ | N/A | 10.98% |
| DPS Growth (5Y CAGR) ⓘ | N/A | 9.48% |
Quality (Business durability) | ||
| ROIC (Latest) ⓘ | N/A | 10.92% |
| ROA (Latest) ⓘ | -4.61% | 5.41% |
| ROIC (5Y Median) ⓘ | -4.32% | 9.21% |
| ROA (5Y Median) ⓘ | -4.72% | 4.94% |
| Net Debt / EBIT (Latest) ⓘ | N/A | 2.07 |
| Net Debt / EBIT (5Y Median) ⓘ | N/A | 2.28 |
| Net Debt / EBITDA (Latest) ⓘ | N/A | 1.43 |
| Net Debt / Assets ⓘ | -18.98% | 19.27% |
| EBITDA / Interest ⓘ | N/A | 9.53 |
| Operating Margin (Latest) ⓘ | -18.30% | 10.50% |
| Operating Margin (5Y Median) ⓘ | -8.47% | 10.27% |
| Debt to Equity (Latest) ⓘ | 21.36% | 65.48% |
| Profit Margin (Latest) ⓘ | -24.13% | 6.62% |
| Free Cash Flow (Latest) ⓘ | -$85.13M | |
Momentum (Price trend) | ||
| 3Y Return ⓘ | +1376.23% | +58.56% |
| 12M Return (excl. last month) ⓘ | +72.11% | +15.63% |
| 6M Return ⓘ | +31.42% | +4.19% |
| Price vs. 200-Day MA ⓘ | +20.20% | +0.93% |
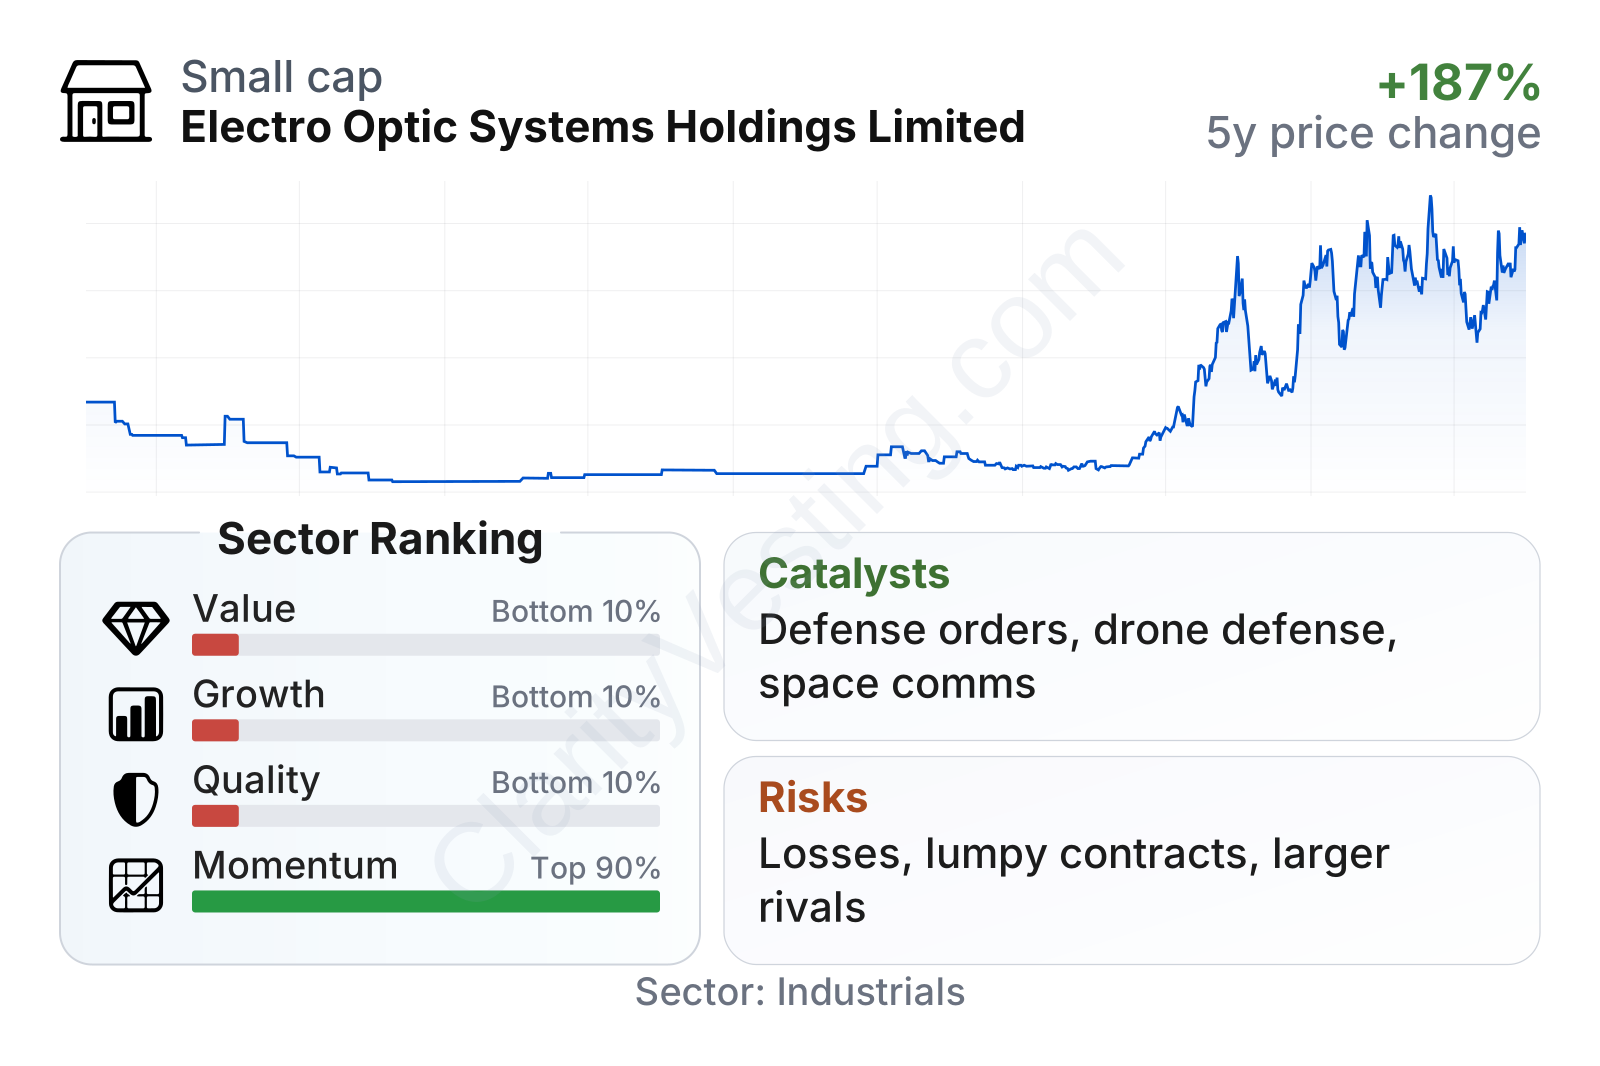
EOS is currently a mid-sized listed defense name with unusually high share-price volatility, reflected in a beta above 2. The stock has been very strong over the last one to three years, far ahead of the sector median, which shows that market expectations have risen sharply. At the same time, the fundamental profile is still weak: value, growth, and quality metrics rank near the bottom of the sector, with negative free cash flow, negative margins, and returns on assets below industry norms. One clear positive is balance-sheet leverage: debt relative to equity is lower than the sector median, and net debt to assets is negative, which points to a net cash position rather than a heavily indebted balance sheet.
Growth
EOS operates in parts of the market that have strong long-term tailwinds. Global defense budgets have been rising in many countries, especially around border security, battlefield automation, remotely operated weapons, and protection against drones. Those are all areas connected to the company’s defense offering. On the space side, growth in satellite constellations and demand for higher-speed communications create a logical opening for optical communication technologies, even if that opportunity is still less proven commercially than the defense business.
The company’s strategy is understandable from a long-term perspective. It is trying to position itself where militaries increasingly want modernized equipment: more remote operation, more survivability for crews, more sensors, and more integrated systems. This direction makes strategic sense because remote weapon stations and counter-drone technologies fit current procurement priorities in many allied countries. If EOS can turn this positioning into repeat orders and larger installed fleets, revenue visibility could improve meaningfully.
A strong catalyst is contract momentum. Defense companies often change scale when they move from occasional project wins to repeat production contracts. EOS has highlighted contract awards, pipeline development, and expanding defense relationships in recent company communications. For a company of this size, even a limited number of larger orders can materially affect future revenue and factory utilization.
Another catalyst is execution improvement. The recent financial pattern suggests that product economics have improved from the 2022 low point, but the company still needs operating leverage. If manufacturing and overhead costs are spread across a higher revenue base, margins could recover faster than revenue growth alone would suggest.
There is also a market-structure catalyst. Many defense ministries are looking to diversify suppliers rather than rely only on the largest prime contractors. That can create opportunities for specialized companies like EOS, especially in niche systems where speed, customization, and export flexibility matter.
Risks
This article is for informational purposes only and does not constitute financial advice. Some content is AI-generated. See Disclaimer


