Stock Analysis · EOG Resources Inc (EOG)
Overview
EOG Resources is a large U.S. oil and gas exploration and production company. In simple terms, it finds hydrocarbon reserves, drills wells, produces crude oil, natural gas liquids, and natural gas, and then sells those commodities into the market. Its operations are concentrated in major U.S. shale basins, especially the Permian Basin, Eagle Ford, and Utica, with additional activity in other domestic plays and some international positions. The business is straightforward, but its results are heavily influenced by production volumes, drilling efficiency, and most importantly commodity prices.
The company’s revenue comes mainly from selling the hydrocarbons it produces. Based on recent annual filings, the mix is led by crude oil, followed by natural gas liquids and then natural gas. Exact percentages can move from year to year with pricing, but the broad revenue profile is typically concentrated as follows:
- Crude oil: approximately 65% to 75% of total revenue. This is the company’s most important earnings driver and generally carries the strongest economics.
- Natural gas liquids: approximately 15% to 20%. This includes products such as propane, butane, and condensate-like liquids separated during processing.
- Natural gas: approximately 10% to 15%. This is sold into domestic gas markets and can be more volatile depending on regional prices.
- Other operating revenue: a small remainder, usually tied to marketing and miscellaneous activities.
EOG’s operating model is built around owning a large inventory of drilling locations, applying technology to improve well productivity, and keeping costs low enough to remain profitable across different commodity cycles. That matters because in energy, scale alone is not enough; the ability to earn strong returns when oil and gas prices soften is what separates the stronger operators from the weaker ones.
The financial flow also shows a clear pattern: revenue surged during the stronger pricing environment of 2022, then moderated, while profitability remained unusually solid for the sector. Even after that normalization, the company still converts a sizable portion of sales into operating income and net income, which supports dividends, buybacks, and reinvestment.
Key Figures
| Metric | Value | Sector ⓘ |
|---|---|---|
| Date | Oct 17, 2026 | |
| Context | ||
| Sector | Energy | |
| Industry | Oil & Gas E&P | |
| Market Cap ⓘ | $81.58B | |
| Beta ⓘ | 0.37 | |
Value (Cheapness) | ||
| P/E Ratio ⓘ | 12.11 | 15.44 |
| P/B Ratio ⓘ | 2.56 | 1.73 |
| FCF Yield ⓘ | 8.11% | 8.20% |
| Dividend Yield ⓘ | 2.71% | 3.59% |
| EBIT / EV ⓘ | 11.60% | 7.46% |
| PEG ⓘ | 1.35 | |
Growth (Business expansion) | ||
| Revenue Growth ⓘ | 58.70% | 26.90% |
| RPS Growth (5Y CAGR) ⓘ | 5.68% | 6.90% |
| EPS Growth (5Y CAGR) ⓘ | -12.10% | -15.73% |
| BVPS Growth (5Y CAGR) ⓘ | 9.86% | 6.07% |
| Margin Growth (5Y Trend) ⓘ | -2.41% | 0.58% |
| FCF Growth (5Y CAGR) ⓘ | -8.59% | 1.86% |
| DPS Growth (5Y CAGR) ⓘ | -3.37% | 16.79% |
Quality (Business durability) | ||
| ROIC (Latest) ⓘ | 18.35% | 11.40% |
| ROA (Latest) ⓘ | 12.85% | 6.06% |
| ROIC (5Y Median) ⓘ | 19.81% | 10.30% |
| ROA (5Y Median) ⓘ | 14.07% | 5.42% |
| Net Debt / EBIT (Latest) ⓘ | 0.37 | 1.64 |
| Net Debt / EBIT (5Y Median) ⓘ | -0.00 | 1.83 |
| Net Debt / EBITDA (Latest) ⓘ | 0.24 | 1.08 |
| Net Debt / Assets ⓘ | 6.10% | 17.29% |
| EBITDA / Interest ⓘ | 54.38 | 9.64 |
| Operating Margin (Latest) ⓘ | 33.72% | 16.27% |
| Operating Margin (5Y Median) ⓘ | 34.18% | 20.39% |
| Debt to Equity (Latest) ⓘ | 25.89% | 54.76% |
| Profit Margin (Latest) ⓘ | 25.73% | 8.82% |
| Free Cash Flow (Latest) ⓘ | $6.61B | |
Momentum (Price trend) | ||
| 3Y Return ⓘ | +28.12% | +67.38% |
| 12M Return (excl. last month) ⓘ | +30.08% | +49.19% |
| 6M Return ⓘ | +17.18% | +7.07% |
| Price vs. 200-Day MA ⓘ | +16.14% | +9.56% |
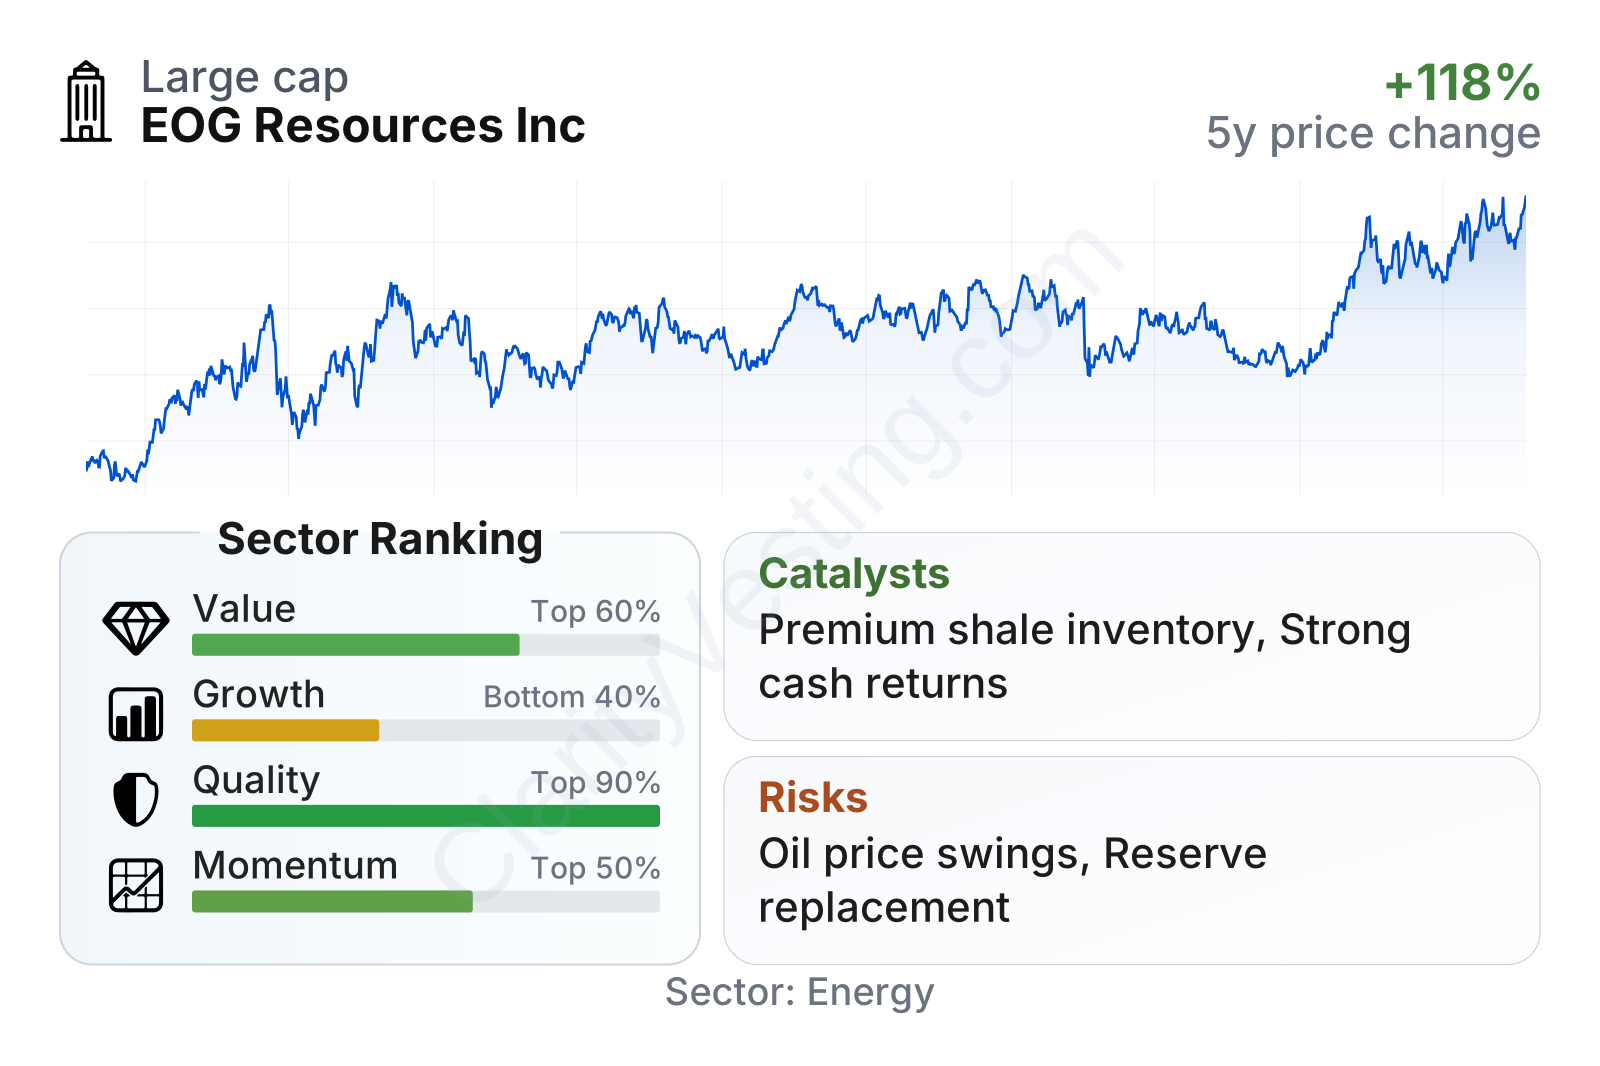
EOG is a very large energy producer with a market value in the tens of billions of dollars, yet its share price volatility is relatively muted for an oil and gas stock, with a beta well below 1. In the factor table, the strongest feature is quality: returns on capital and assets are far above the sector median, margins are much stronger than peers, and leverage remains notably lower than most competitors. Value also looks supportive, with earnings and enterprise-value-based measures generally more attractive than the sector even after the stock’s recovery. The weaker area is growth, where the long-term record is more mixed because commodity cycles can distort revenue and cash flow trends, and momentum is only middle-of-the-pack rather than a clear leadership signal.
Growth
Oil and gas production is not a classic high-growth industry, but it remains a strategically important one. Global energy demand has continued to grow, and even in scenarios with rising renewable adoption, oil and natural gas are still expected to play a major role for years because they remain essential for transport, petrochemicals, industrial activity, power reliability, and export markets. That means EOG operates in a sector with durable relevance, though not one with smooth or predictable growth.
EOG’s strategy for future expansion is centered less on aggressive volume growth and more on disciplined, high-return growth. Management has emphasized premium drilling inventory, capital efficiency, and maintaining flexibility through the cycle. For a long-term view, that is a sensible approach: it reduces the pressure to overspend when commodity prices are high and can preserve balance sheet strength when the market weakens.
Recent revenue growth has been uneven, which is normal for a producer whose sales depend on both output and market prices. The latest year-over-year rebound is strong, but the broader pattern shows that top-line growth can swing sharply from quarter to quarter. That makes it important to look beyond revenue alone and focus on cost control, margins, and cash generation.
Free cash flow has remained substantial even after retreating from peak cycle levels. That is important because free cash flow is what funds dividends, share repurchases, debt management, and new drilling without relying on outside financing. EOG’s ability to keep generating billions of dollars of free cash flow outside the absolute peak pricing environment supports the argument that its asset base is resilient rather than simply lucky in one strong year.
One of the clearest catalysts is the company’s inventory depth in premium U.S. shale acreage. Another is its long-standing focus on operational improvements such as drilling productivity, completion design, and cost discipline. In addition, a supportive U.S. export backdrop for crude oil and liquefied natural gas can indirectly help domestic producers by strengthening demand for hydrocarbons produced in North America. Recent company updates have also pointed to continued activity optimization and capital returns, reinforcing the idea that EOG is trying to compound value through efficiency rather than through risky expansion.
Risks
This article is for informational purposes only and does not constitute financial advice. Some content is AI-generated. See Disclaimer


