Stock Analysis · Enova International Inc (ENVA)
Overview
Enova International is a digital lending and financial technology company focused on consumers and small businesses that often need fast access to credit. The company uses its own analytics, automated underwriting, and online servicing platform to originate and manage loans. In practice, Enova operates mainly in non-prime consumer lending and small business financing, two parts of the credit market where speed, risk assessment, and collections capabilities matter a great deal.
Its business is built around lending products rather than traditional banking services such as deposits or branch-based relationships. Revenue comes primarily from finance charges, interest income, and fees generated on loans and receivables, along with gains related to loan sales and securitization activity when applicable. Based on company disclosures in recent annual reporting, the business is centered on two major product groupings:
- Consumer loans and finance receivables: approximately 60% to 70% of revenue in recent years. This includes installment loans, lines of credit, and other consumer credit products offered online through brands such as CashNetUSA and NetCredit.
- Small business loans and receivables: approximately 30% to 40% of revenue in recent years. This includes term loans and lines of credit for small businesses through brands such as OnDeck.
That mix can shift over time depending on credit demand, underwriting standards, and the economic environment. The broader trend has been a larger and more diversified platform than Enova had several years ago, helped by expansion in small business lending after the OnDeck acquisition and continued scaling of its online credit infrastructure.
Another useful way to understand Enova is by how its earnings flow through the income statement. Revenue has expanded strongly over the last five years, while operating income and net income have been more cyclical because credit losses and funding costs can move sharply with the economy. Even so, the recent pattern shows a meaningful rebound in profitability after a weaker period in 2022 and 2023.
Over the last five years, revenue increased from roughly $1.2 billion to more than $3.1 billion, while operating income climbed to its highest level in that period by 2025. Interest expense rose materially through 2024 as funding became more expensive, then improved in 2025, which helped earnings recover. This confirms that Enova’s model can scale, but it also shows how sensitive results are to credit costs and financing conditions.
Key Figures
| Metric | Value | Sector ⓘ |
|---|---|---|
| Date | Oct 03, 2026 | |
| Context | ||
| Sector | Financial Services | |
| Industry | Credit Services | |
| Market Cap ⓘ | $4.16B | |
| Beta ⓘ | 1.21 | |
Value (Cheapness) | ||
| P/E Ratio ⓘ | 12.41 | 12.60 |
| P/B Ratio ⓘ | 3.02 | 1.23 |
| FCF Yield ⓘ | 46.93% | 10.16% |
| Dividend Yield ⓘ | N/A | 2.96% |
| EBIT / EV ⓘ | 8.13% | 7.77% |
| PEG ⓘ | N/A | |
Growth (Business expansion) | ||
| Revenue Growth ⓘ | 31.10% | 9.50% |
| RPS Growth (5Y CAGR) ⓘ | 39.02% | 12.10% |
| EPS Growth (5Y CAGR) ⓘ | 4.11% | -9.45% |
| BVPS Growth (5Y CAGR) ⓘ | 15.03% | 5.01% |
| Margin Growth (5Y Trend) ⓘ | -12.38% | -4.07% |
| FCF Growth (5Y CAGR) ⓘ | 41.49% | 4.96% |
| DPS Growth (5Y CAGR) ⓘ | 61.46% | 8.79% |
Quality (Business durability) | ||
| ROIC (Latest) ⓘ | 9.60% | 9.60% |
| ROE (Latest) ⓘ | 25.56% | 13.84% |
| ROA (Latest) ⓘ | 5.39% | 1.53% |
| ROIC (5Y Median) ⓘ | 6.89% | 7.86% |
| ROE (5Y Median) ⓘ | 18.20% | 12.20% |
| ROA (5Y Median) ⓘ | 5.26% | 1.29% |
| Net Debt / EBIT (Latest) ⓘ | 6.63 | 0.91 |
| Net Debt / EBIT (5Y Median) ⓘ | 9.20 | 0.74 |
| Net Debt / EBITDA (Latest) ⓘ | 6.30 | 0.97 |
| Operating Margin (Latest) ⓘ | 24.65% | 22.12% |
| Operating Margin (5Y Median) ⓘ | 15.44% | 24.39% |
| Debt to Equity (Latest) ⓘ | 337.01% | 60.37% |
| Profit Margin (Latest) ⓘ | 21.01% | 26.62% |
| Free Cash Flow (Latest) ⓘ | $1.95B | |
Momentum (Price trend) | ||
| 3Y Return ⓘ | +242.02% | +89.23% |
| 12M Return (excl. last month) ⓘ | +82.31% | +17.35% |
| 6M Return ⓘ | +25.28% | +10.00% |
| Price vs. 200-Day MA ⓘ | -5.88% | +3.73% |
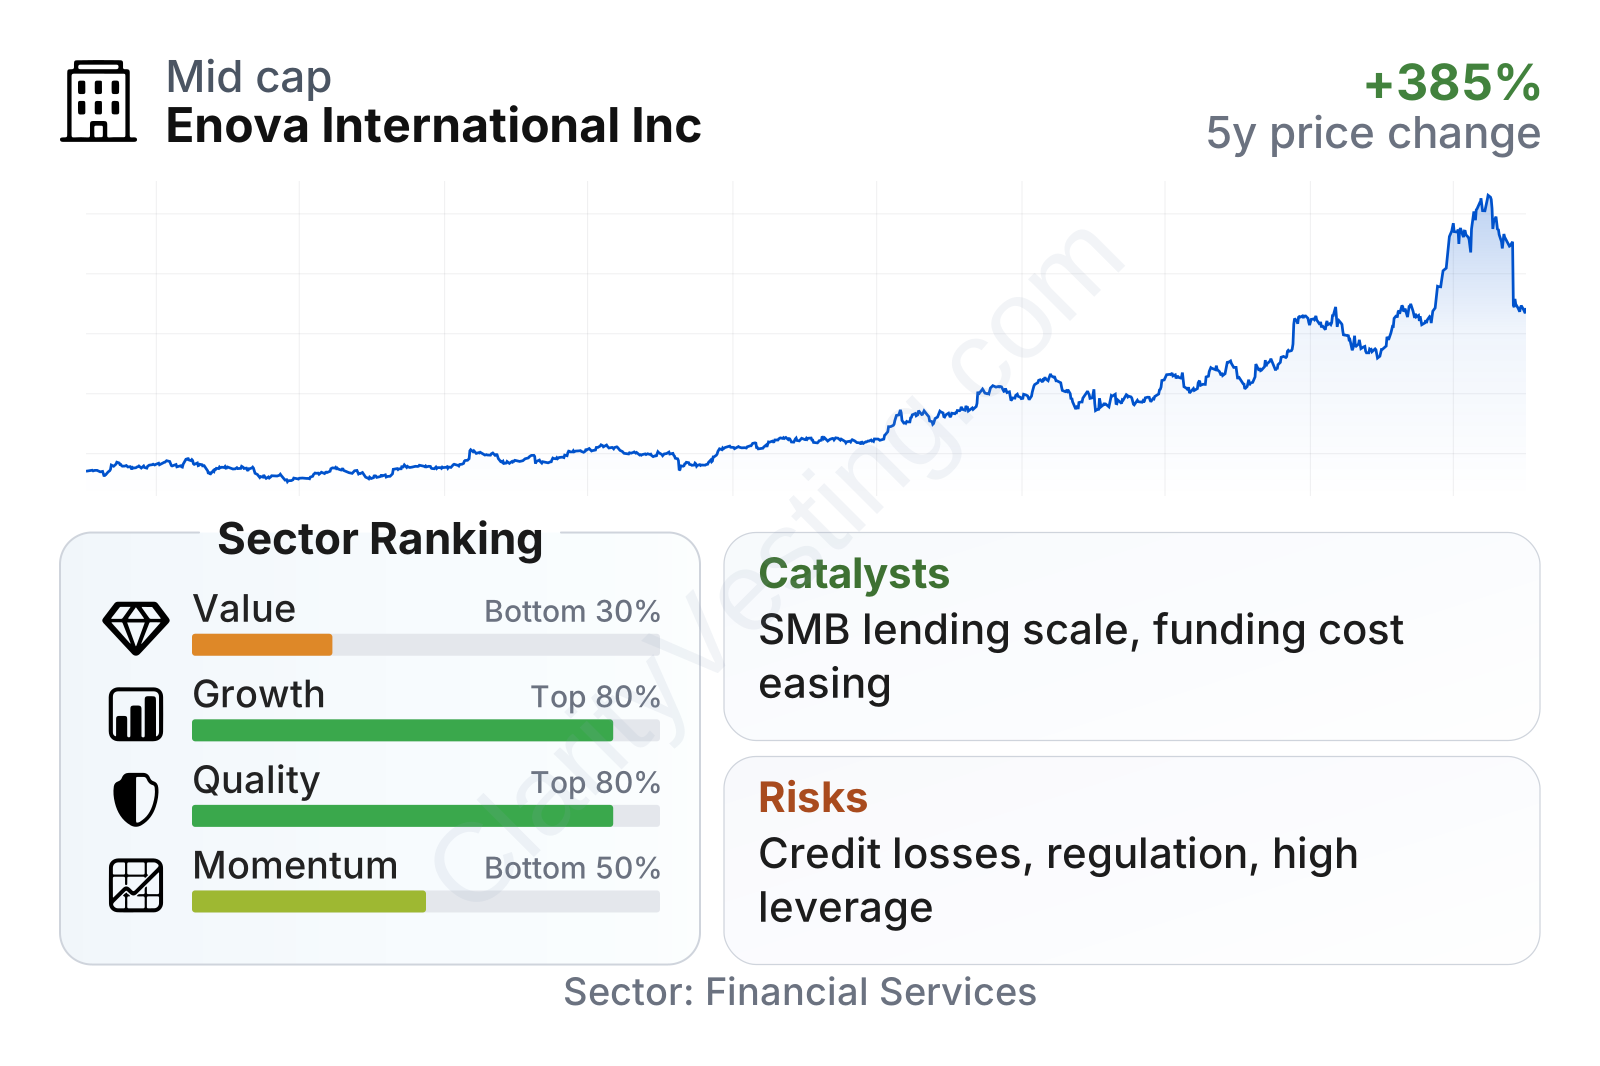
Enova is now a mid-sized public company with a market value around $4 billion and a share price that has risen very sharply since 2022, despite periods of volatility. The factor profile is unusual: growth and quality metrics rank well above much of the sector, while the value profile looks less attractive after the stock’s rerating. Revenue growth, return on equity, return on assets, and free cash flow stand out positively, but leverage remains much higher than the sector median and the shares no longer trade at the discount seen a few years ago.
Growth
Enova operates in parts of the credit market that continue to have long-term demand. Many consumers remain underserved by traditional banks, and small businesses often need quick working-capital solutions that large banks do not provide efficiently. That does not make the industry risk-free, but it does mean the addressable market is large and persistent. Digital origination, automated underwriting, and data-driven servicing are structural advantages in a market where speed and convenience influence customer behavior.
The company’s strategy appears coherent for future expansion. It combines consumer lending and small business lending on one technology backbone, which can improve operating efficiency and spread fixed platform costs across a larger loan base. Enova has also emphasized analytics and machine learning in underwriting, which is especially important in non-prime credit because small changes in risk selection can have a large effect on future charge-offs and returns.
Its recent operating momentum has been strong. Revenue growth of about 31% year over year is far above the sector median, and five-year growth in revenue per share and free cash flow has also been notably stronger than peers. Earnings per share have not moved in a straight line, but the broader trend has turned decisively upward after the softer 2022-2023 period.
The earnings trend shows a business that absorbed a difficult credit and funding period, then returned to a much stronger profit base. EPS moved from the high-$7 range in 2021 to above $13 in 2025, which is a meaningful improvement for a lender of this size. That matters because it suggests recent stock performance has been supported by real earnings expansion rather than only by multiple expansion.
Book value per share has also compounded at a healthy pace, rising from about $29 in 2021 to above $50 by 2025. For a lending business, this is an important sign because book value growth reflects retained earnings, portfolio expansion, and the company’s ability to build capital over time. Stronger book value gives Enova more room to support receivables growth, absorb credit volatility, and continue returning capital when management chooses to do so.
A key catalyst is the continued scaling of small business lending alongside consumer credit. The company has already shown it can grow across both segments, which reduces reliance on any single borrower group. Another catalyst is funding normalization: if borrowing costs remain more manageable than they were during the 2023-2024 pressure period, earnings conversion could remain favorable. Recent company communications have also highlighted ongoing demand trends and credit discipline, which supports the idea that growth is not simply being bought through looser underwriting.
Risks
This article is for informational purposes only and does not constitute financial advice. Some content is AI-generated. See Disclaimer


