Stock Analysis · Canoe EIT Income Fund (ENDTF)
Overview
Canoe EIT Income Fund is a Canadian closed-end investment fund managed by Canoe Financial. Unlike an operating company that sells products or services, the fund’s role is to own a portfolio of securities and distribute cash to unitholders. Its portfolio is built mainly around income-producing investments, with meaningful exposure to equities, income trusts, fixed-income securities, and other yield-oriented assets. The objective is to generate attractive monthly distributions while also seeking long-term capital appreciation.
Because this is an investment fund, its economic engine is different from a typical business. Revenue and earnings are driven mostly by portfolio performance rather than by selling goods. Based on public filings and portfolio disclosures, the main sources of economic return are generally:
- Dividend and distribution income from portfolio holdings — a recurring source of cash flow from equities, REITs, infrastructure vehicles, and other income-oriented investments.
- Realized gains on investments — gains locked in when portfolio positions are sold above their purchase price.
- Unrealized gains or losses — changes in the market value of holdings that affect reported results, sometimes sharply from year to year.
- Interest and other income — a smaller contribution from bonds, cash balances, and similar instruments.
Unlike a normal corporation, Canoe EIT’s revenue mix is not stable enough to present a precise operating breakdown by segment in the same way one would for a manufacturer or software company. The largest driver of reported performance is typically market value changes in the investment portfolio, followed by cash distributions and dividends received from holdings, while interest and other income remain comparatively smaller.
The financial profile reflects that structure. Reported revenue and profit can swing significantly with market conditions, but operating costs have remained low compared with the size of assets managed inside the fund. That makes asset allocation, sector exposure, and capital markets conditions more important than traditional measures such as unit sales or pricing power.
The flow of income and expenses shows a business model with very limited direct operating costs and results dominated by investment gains and losses. That can produce unusually high margins in strong markets, but it also means year-to-year results can be volatile and should be read alongside net asset value trends, book value per share, and distribution sustainability.
Key Figures
| Metric | Value | Sector ⓘ |
|---|---|---|
| Date | Oct 03, 2026 | |
| Context | ||
| Sector | Financial Services | |
| Industry | Asset Management | |
| Market Cap ⓘ | $2.37B | |
| Beta ⓘ | 0.70 | |
Value (Cheapness) | ||
| P/E Ratio ⓘ | 24.16 | 12.60 |
| P/B Ratio ⓘ | 0.47 | 1.23 |
| FCF Yield ⓘ | 4.56% | 10.16% |
| Dividend Yield ⓘ | 9.74% | 2.96% |
| EBIT / EV ⓘ | N/A | 7.77% |
| PEG ⓘ | N/A | |
Growth (Business expansion) | ||
| Revenue Growth ⓘ | 112.00% | 9.50% |
| RPS Growth (5Y CAGR) ⓘ | -10.99% | 12.10% |
| EPS Growth (5Y CAGR) ⓘ | N/A | -9.45% |
| BVPS Growth (5Y CAGR) ⓘ | 11.93% | 5.01% |
| Margin Growth (5Y Trend) ⓘ | 98.55% | -4.07% |
| FCF Growth (5Y CAGR) ⓘ | N/A | 4.96% |
| DPS Growth (5Y CAGR) ⓘ | 8.53% | 8.79% |
Quality (Business durability) | ||
| ROIC (Latest) ⓘ | N/A | 9.60% |
| ROE (Latest) ⓘ | 36.43% | 13.84% |
| ROA (Latest) ⓘ | 31.92% | 1.53% |
| ROIC (5Y Median) ⓘ | N/A | 7.86% |
| ROE (5Y Median) ⓘ | 12.57% | 12.20% |
| ROA (5Y Median) ⓘ | 11.45% | 1.29% |
| Net Debt / EBIT (Latest) ⓘ | N/A | 0.91 |
| Net Debt / EBIT (5Y Median) ⓘ | -0.00 | 0.74 |
| Net Debt / EBITDA (Latest) ⓘ | 0.46 | 0.97 |
| Operating Margin (Latest) ⓘ | N/A | 22.12% |
| Operating Margin (5Y Median) ⓘ | 137.10% | 24.39% |
| Debt to Equity (Latest) ⓘ | 16.46% | 60.37% |
| Profit Margin (Latest) ⓘ | 88.87% | 26.62% |
| Free Cash Flow (Latest) ⓘ | $108.18M | |
Momentum (Price trend) | ||
| 3Y Return ⓘ | +66.79% | +89.23% |
| 12M Return (excl. last month) ⓘ | +22.77% | +17.35% |
| 6M Return ⓘ | +3.82% | +10.00% |
| Price vs. 200-Day MA ⓘ | +5.92% | +3.73% |
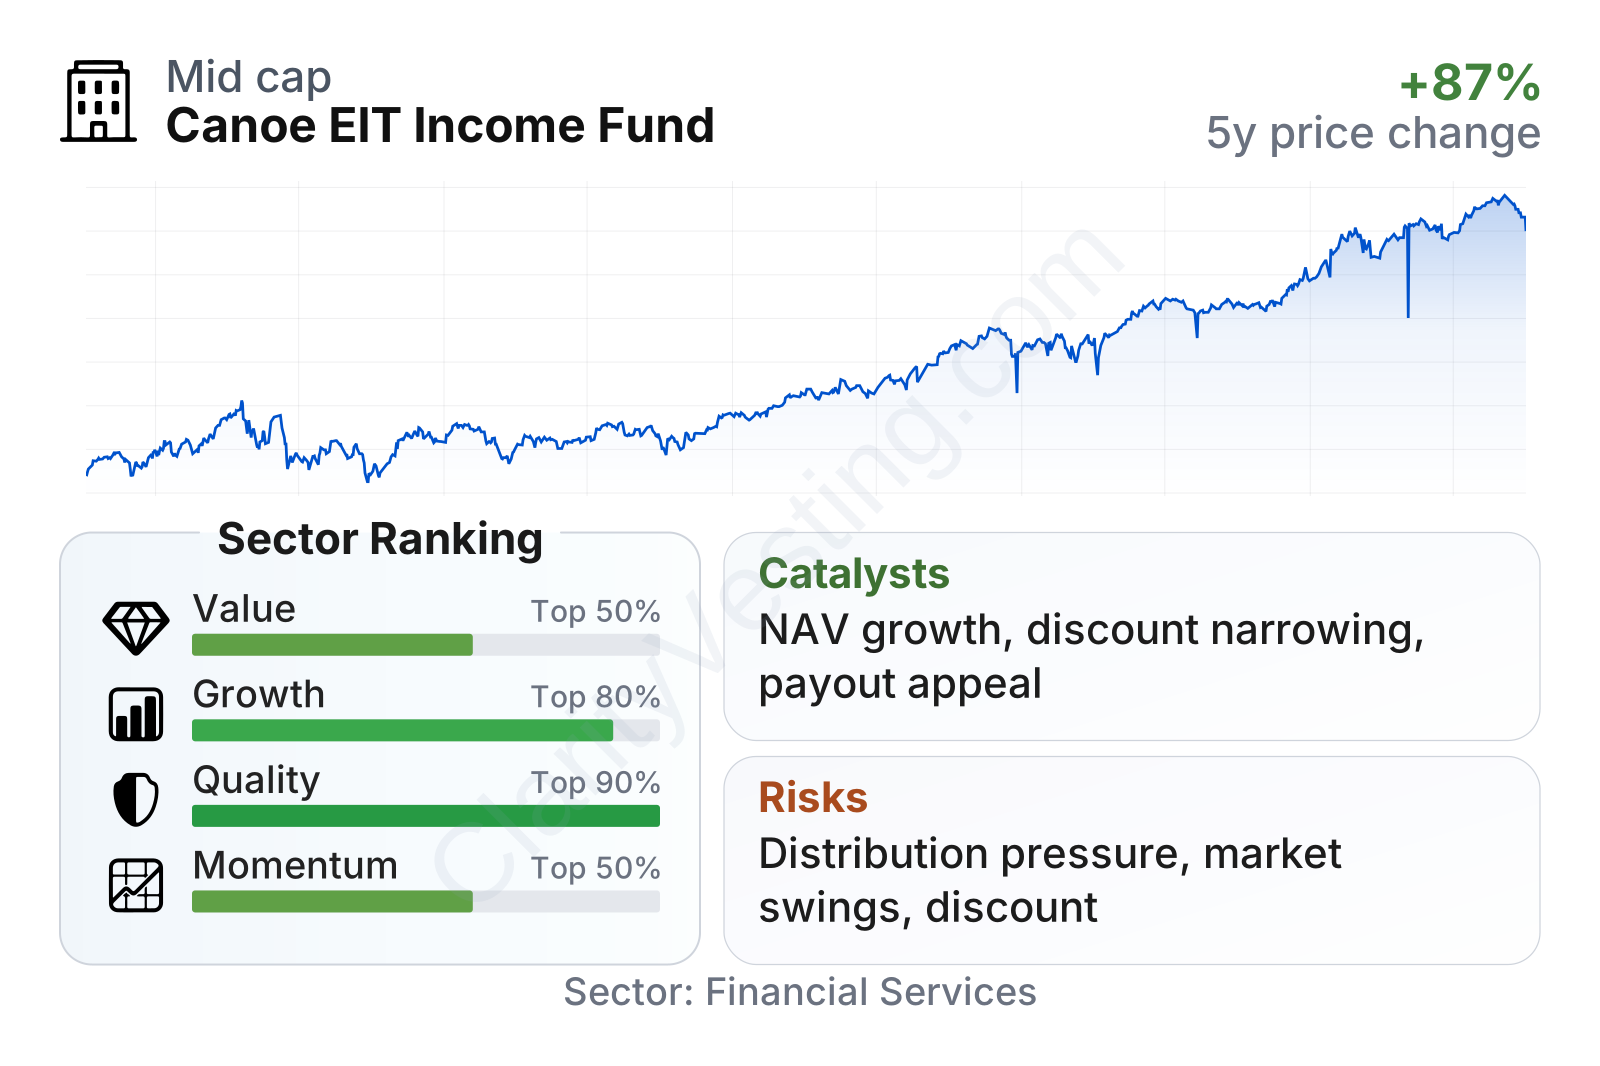
Canoe EIT stands out more on balance-sheet strength, profitability, and income generation than on conventional value metrics. The fund’s quality measures are well above most of the financial sector, helped by low leverage, strong returns on equity and assets, and unusually high reported profit margins. Growth indicators are mixed: recent year-over-year expansion has been very strong, but the longer-term revenue-per-share record is less consistent, which is common for market-driven vehicles. The shares have also shown constructive price momentum over the last year, though not at the very top of the sector over a full three-year period.
The stock’s market behavior has been relatively steady for a listed fund, with a beta below 1. That suggests price swings have been milder than the broader market on average. The company is also mid-sized within the listed fund universe, large enough to be established but still highly influenced by portfolio performance and investor sentiment toward income products.
Growth
Canoe EIT operates in a part of the market that remains relevant for long-term savers: income-focused investment products. Demand for regular cash distributions has stayed resilient, especially among retirees and income-oriented households. In addition, periods of lower interest rates can improve the appeal of equity income funds, while stable or rising asset prices lift net asset value and support distribution coverage.
The strategy is reasonably clear. Management combines income generation with broad diversification across sectors and asset classes, rather than relying on a narrow niche. That can support future growth in net assets if portfolio performance remains competitive and if distributions continue to attract capital. The fund also benefits from a structure that allows it to trade independently from the exact value of its holdings, which can create opportunities when investor demand improves and the discount to underlying asset value narrows.
Earnings are best interpreted cautiously here because they reflect portfolio marks and realized gains, not a steady operating business. Even so, the recent pattern points to continued profitability, supported by stronger market conditions and appreciation in the underlying holdings.
Book value per share has moved up strongly over the last few years after an earlier dip, which is an encouraging sign for a fund where net asset value is central to long-term performance. The five-year compound growth rate in book value per share is notably ahead of the sector median, suggesting that the portfolio has compounded capital better than many peers over that period.
A notable recent tailwind is the combination of rising book value, improving share price, and continued high cash distributions. When those three factors move in the same direction, they can strengthen market confidence in the fund structure. Another positive signal is that operating margin trends and year-over-year revenue growth have been exceptionally strong, even if those figures can be noisy for a fund.
Risks
This article is for informational purposes only and does not constitute financial advice. Some content is AI-generated. See Disclaimer


