Stock Analysis · Eastman Chemical Company (EMN)
Overview
Eastman Chemical Company is a specialty materials and chemicals producer. In simple terms, it makes ingredients and engineered materials that other companies use in everyday products such as packaging, durable plastics, coatings, building materials, transportation components, fibers, personal care products, and additives used in industrial processes. The company traces its roots to Tennessee Eastman and today operates globally, with a business mix that is broader and more specialized than a basic commodity chemical producer.
Its revenue comes from four main operating segments. Based on the latest annual reporting structure, the mix is approximately:
- Advanced Materials: about 35% of revenue. This segment includes specialty plastics, films, interlayers, and materials used in transportation, building and construction, medical applications, and consumer durable goods.
- Additives & Functional Products: about 29%. This area includes coatings additives, specialty fluids, aviation fluids, care chemicals, and other performance ingredients that improve how finished products work.
- Chemical Intermediates: about 20%. This segment sells acetyl products and olefin derivatives used as feedstocks for industrial and chemical applications. It is generally more exposed to economic cycles than Eastman’s specialty businesses.
- Fibers: about 16%. This business mainly includes acetate tow and textile yarns used in cigarette filters, apparel, and specialty materials.
That mix matters because Eastman is not just selling undifferentiated chemicals. A large share of its business is tied to specialty products where formulation know-how, customer relationships, and manufacturing scale can support better margins than pure commodity markets. At the same time, it still has meaningful exposure to cyclical industrial demand and raw-material costs, so results can swing when manufacturing activity slows.
Over the last several years, revenue has moved around more than profits. Sales peaked above $10 billion earlier in the cycle, fell during the industrial slowdown, recovered somewhat in 2024, and then softened again in 2025. Even so, the business has remained solidly profitable and still generated hundreds of millions of dollars in annual free cash flow. Gross profit improved in 2024 before a noticeable earnings drop in 2025, showing that Eastman’s biggest challenge recently has been maintaining margins consistently through weaker demand and pricing pressure.
The financial flow highlights a business that still converts a large revenue base into meaningful operating profit, but with a visible margin squeeze in the latest full year. Revenue and production costs have both come down from earlier peaks, while operating income and net income weakened more sharply in 2025, which points to reduced pricing power and lower absorption of fixed costs.
Key Figures
| Metric | Value | Sector ⓘ |
|---|---|---|
| Date | Oct 24, 2026 | |
| Context | ||
| Sector | Basic Materials | |
| Industry | Specialty Chemicals | |
| Market Cap ⓘ | $7.26B | |
| Beta ⓘ | 1.08 | |
Value (Cheapness) | ||
| P/E Ratio ⓘ | 16.58 | 16.92 |
| P/B Ratio ⓘ | 1.20 | 1.66 |
| FCF Yield ⓘ | 7.42% | 5.83% |
| Dividend Yield ⓘ | 5.36% | 2.07% |
| EBIT / EV ⓘ | 6.16% | 6.38% |
| PEG ⓘ | 0.51 | |
Growth (Business expansion) | ||
| Revenue Growth ⓘ | 9.90% | 11.25% |
| RPS Growth (5Y CAGR) ⓘ | -0.25% | 4.49% |
| EPS Growth (5Y CAGR) ⓘ | -22.17% | -15.24% |
| BVPS Growth (5Y CAGR) ⓘ | 5.57% | 5.49% |
| Margin Growth (5Y Trend) ⓘ | -3.29% | -1.54% |
| FCF Growth (5Y CAGR) ⓘ | -20.11% | 0.37% |
| DPS Growth (5Y CAGR) ⓘ | 4.77% | 5.91% |
Quality (Business durability) | ||
| ROIC (Latest) ⓘ | N/A | 9.59% |
| ROA (Latest) ⓘ | 2.91% | 4.92% |
| ROIC (5Y Median) ⓘ | 8.92% | 7.91% |
| ROA (5Y Median) ⓘ | 5.42% | 3.92% |
| Net Debt / EBIT (Latest) ⓘ | 6.04 | 1.36 |
| Net Debt / EBIT (5Y Median) ⓘ | 4.02 | 1.69 |
| Net Debt / EBITDA (Latest) ⓘ | 3.56 | 0.93 |
| Net Debt / Assets ⓘ | 29.34% | 13.69% |
| EBITDA / Interest ⓘ | 5.97 | 12.38 |
| Operating Margin (Latest) ⓘ | 8.45% | 13.24% |
| Operating Margin (5Y Median) ⓘ | 11.90% | 11.82% |
| Debt to Equity (Latest) ⓘ | 85.58% | 40.30% |
| Profit Margin (Latest) ⓘ | 4.99% | 6.38% |
| Free Cash Flow (Latest) ⓘ | $539.00M | |
Momentum (Price trend) | ||
| 3Y Return ⓘ | +0.77% | +73.47% |
| 12M Return (excl. last month) ⓘ | +4.97% | +27.59% |
| 6M Return ⓘ | -10.25% | -4.02% |
| Price vs. 200-Day MA ⓘ | -8.83% | -0.65% |
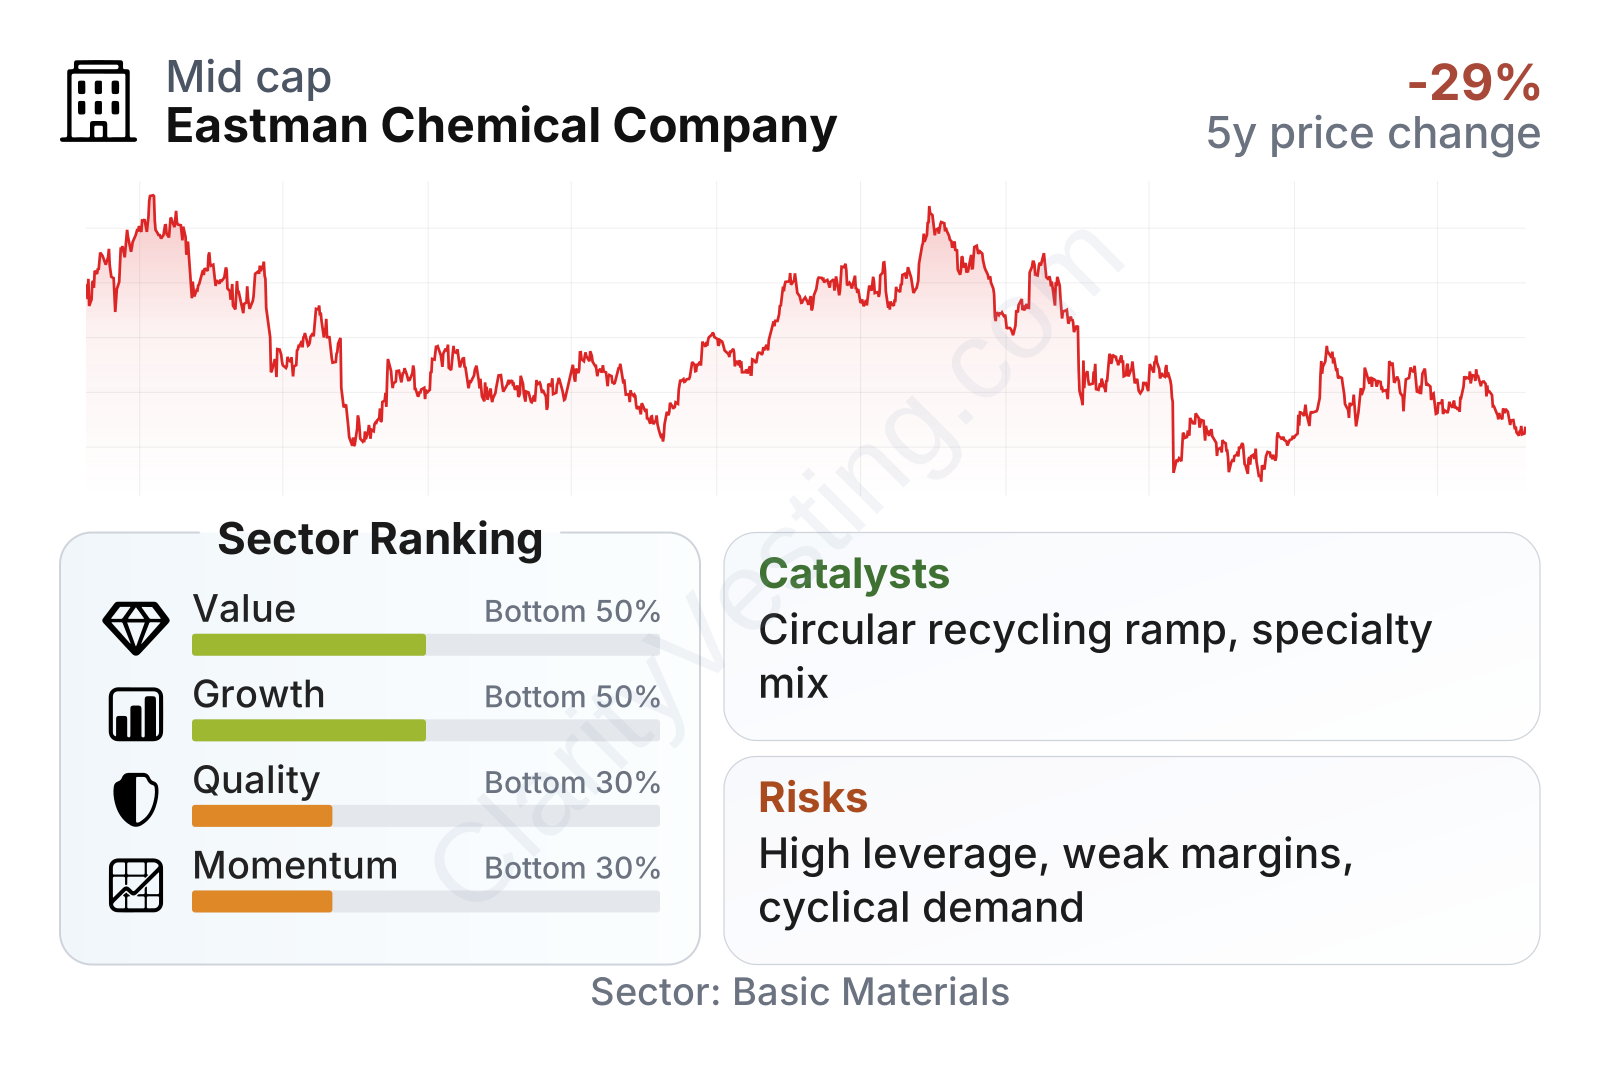
Eastman is a mid-sized specialty chemicals company with a stock that has been volatile rather than steadily trending upward over the last few years. The recent metric profile is mixed. On valuation, the shares look near sector norms on earnings and somewhat lower on book value, while free cash flow yield and dividend yield stand out as stronger than the sector median. On growth, the picture is weaker: one-year revenue growth has recently improved, but the longer five-year record for revenue per share, earnings, and free cash flow is below the sector median. Quality is also uneven, with long-term returns on capital looking respectable, but current leverage, interest coverage, and profitability running weaker than many peers. Momentum remains soft compared with the broader materials sector, which suggests the market is still cautious about the earnings outlook.
Growth
Eastman operates in a sector that can grow over time, but not always smoothly. Specialty materials benefit from durable themes such as lightweighting in transportation, safer and more durable packaging, higher-performance coatings, medical applications, and the push for more circular and recycled materials. These are attractive end markets because they depend on product performance and regulatory standards, not only on commodity price cycles. That gives Eastman a clearer long-term path than a pure bulk chemical producer.
A central part of Eastman’s strategy is moving further toward higher-value specialty products and circular materials. The company has invested heavily in molecular recycling technologies, especially polyester renewal and carbon renewal. These projects are meant to turn hard-to-recycle waste into new material feedstocks, which could help customers meet sustainability targets while also giving Eastman access to differentiated products with stronger pricing.
One of the most important catalysts is the Kingsport methanolysis facility in Tennessee, which Eastman has described as a major step in scaling circular economy materials. A second major project in Longview, Texas has also been part of the company’s growth plan, supported by U.S. policy incentives for advanced recycling and domestic manufacturing. If these plants ramp efficiently, they could strengthen Eastman’s position in recycled-content specialty plastics and create a longer runway for margin expansion than its legacy chemical operations can provide on their own.
Revenue growth has been inconsistent. After a strong post-pandemic rebound, sales growth turned negative for an extended period, briefly improved in 2024, weakened again in 2025, and recently bounced back into positive territory. That pattern suggests Eastman is still closely tied to industrial demand cycles, even while it tries to increase the share of more resilient specialty revenue.
Free cash flow has also been positive but uneven. It remains meaningful in absolute dollars, which is important because these cash flows support dividends, debt service, and capital spending. However, the five-year trend is not strong, partly because Eastman has been funding large strategic projects. In other words, near-term cash generation is being asked to support a transition that may only pay off more clearly over several years.
Another possible growth support is portfolio discipline. Management has continued to emphasize cost actions, operating efficiency, and higher-value applications rather than chasing low-return volume. That approach makes strategic sense in a mature industry: the goal is not simply more revenue, but a better mix of revenue.
Risks
This article is for informational purposes only and does not constitute financial advice. Some content is AI-generated. See Disclaimer


