Stock Analysis · Enliven Therapeutics Inc (ELVN)
Overview
Enliven Therapeutics is a clinical-stage biotechnology company focused on precision cancer medicines. In simple terms, it is developing targeted drugs designed to block specific genetic changes that help tumors grow. The company’s pipeline is centered on small-molecule kinase inhibitors, an important class of cancer drugs that can sometimes offer strong activity with more convenient dosing than older treatment approaches.
As of the latest public filings in 2026, Enliven remains primarily a development-stage business. That means its value today comes from its drug candidates, clinical progress, and future commercial potential rather than from an established product portfolio.
Its lead programs include ELVN-001, being developed for chronic myeloid leukemia, and ELVN-002, being developed for HER2-altered solid tumors, including breast cancer and other cancers with HER2 mutations or amplification. These are the main assets shaping the company’s long-term outlook.
Revenue is still very limited and does not yet reflect a commercial business. Based on recent filings, the current revenue mix is approximately:
- Collaboration and other revenue: nearly 100% — small amounts tied to research-related or partnership-type activity rather than product sales.
- Product revenue: 0% — the company does not yet have an approved medicine on the market.
This is a typical profile for an early biotech: spending is concentrated on research and clinical development, while recurring revenue is minimal. Over the last several years, operating expenses have risen steadily, led by research and development, which has become the dominant use of cash as the pipeline advances.
The financial structure is straightforward: almost no revenue, rising R&D spending, modest administrative costs relative to total spending, and net losses that have widened as trials move forward. That pattern is normal for a company trying to create future oncology products, but it means the investment case depends heavily on clinical execution.
Key Figures
| Metric | Value | Sector ⓘ |
|---|---|---|
| Date | Oct 24, 2026 | |
| Context | ||
| Sector | Healthcare | |
| Industry | Biotechnology | |
| Market Cap ⓘ | $3.06B | |
| Beta ⓘ | 0.34 | |
Value (Cheapness) | ||
| P/E Ratio ⓘ | N/A | 25.42 |
| P/B Ratio ⓘ | 3.10 | 3.08 |
| FCF Yield ⓘ | -2.19% | 3.12% |
| Dividend Yield ⓘ | N/A | 1.85% |
| EBIT / EV ⓘ | -4.26% | 0.56% |
| PEG ⓘ | N/A | |
Growth (Business expansion) | ||
| Revenue Growth ⓘ | N/A | 7.50% |
| RPS Growth (5Y CAGR) ⓘ | N/A | 8.60% |
| EPS Growth (5Y CAGR) ⓘ | -31.08% | -17.73% |
| BVPS Growth (5Y CAGR) ⓘ | -12.24% | 3.72% |
| Margin Growth (5Y Trend) ⓘ | N/A | -0.57% |
| FCF Growth (5Y CAGR) ⓘ | N/A | 0.96% |
| DPS Growth (5Y CAGR) ⓘ | N/A | 6.69% |
Quality (Business durability) | ||
| ROIC (Latest) ⓘ | -14.47% | 3.17% |
| ROA (Latest) ⓘ | -15.12% | 2.98% |
| ROIC (5Y Median) ⓘ | -24.92% | 4.56% |
| ROA (5Y Median) ⓘ | -29.79% | 1.87% |
| Net Debt / EBIT (Latest) ⓘ | N/A | 1.34 |
| Net Debt / EBIT (5Y Median) ⓘ | N/A | 1.86 |
| Net Debt / EBITDA (Latest) ⓘ | N/A | 1.00 |
| Net Debt / Assets ⓘ | -14.72% | 5.06% |
| EBITDA / Interest ⓘ | N/A | 9.55 |
| Operating Margin (Latest) ⓘ | N/A | 9.25% |
| Operating Margin (5Y Median) ⓘ | N/A | 7.33% |
| Debt to Equity (Latest) ⓘ | 0.17% | 26.68% |
| Profit Margin (Latest) ⓘ | N/A | 3.34% |
| Free Cash Flow (Latest) ⓘ | -$67.04M | |
Momentum (Price trend) | ||
| 3Y Return ⓘ | +227.58% | +51.61% |
| 12M Return (excl. last month) ⓘ | +141.92% | +19.90% |
| 6M Return ⓘ | -5.65% | +10.10% |
| Price vs. 200-Day MA ⓘ | -0.49% | +6.44% |
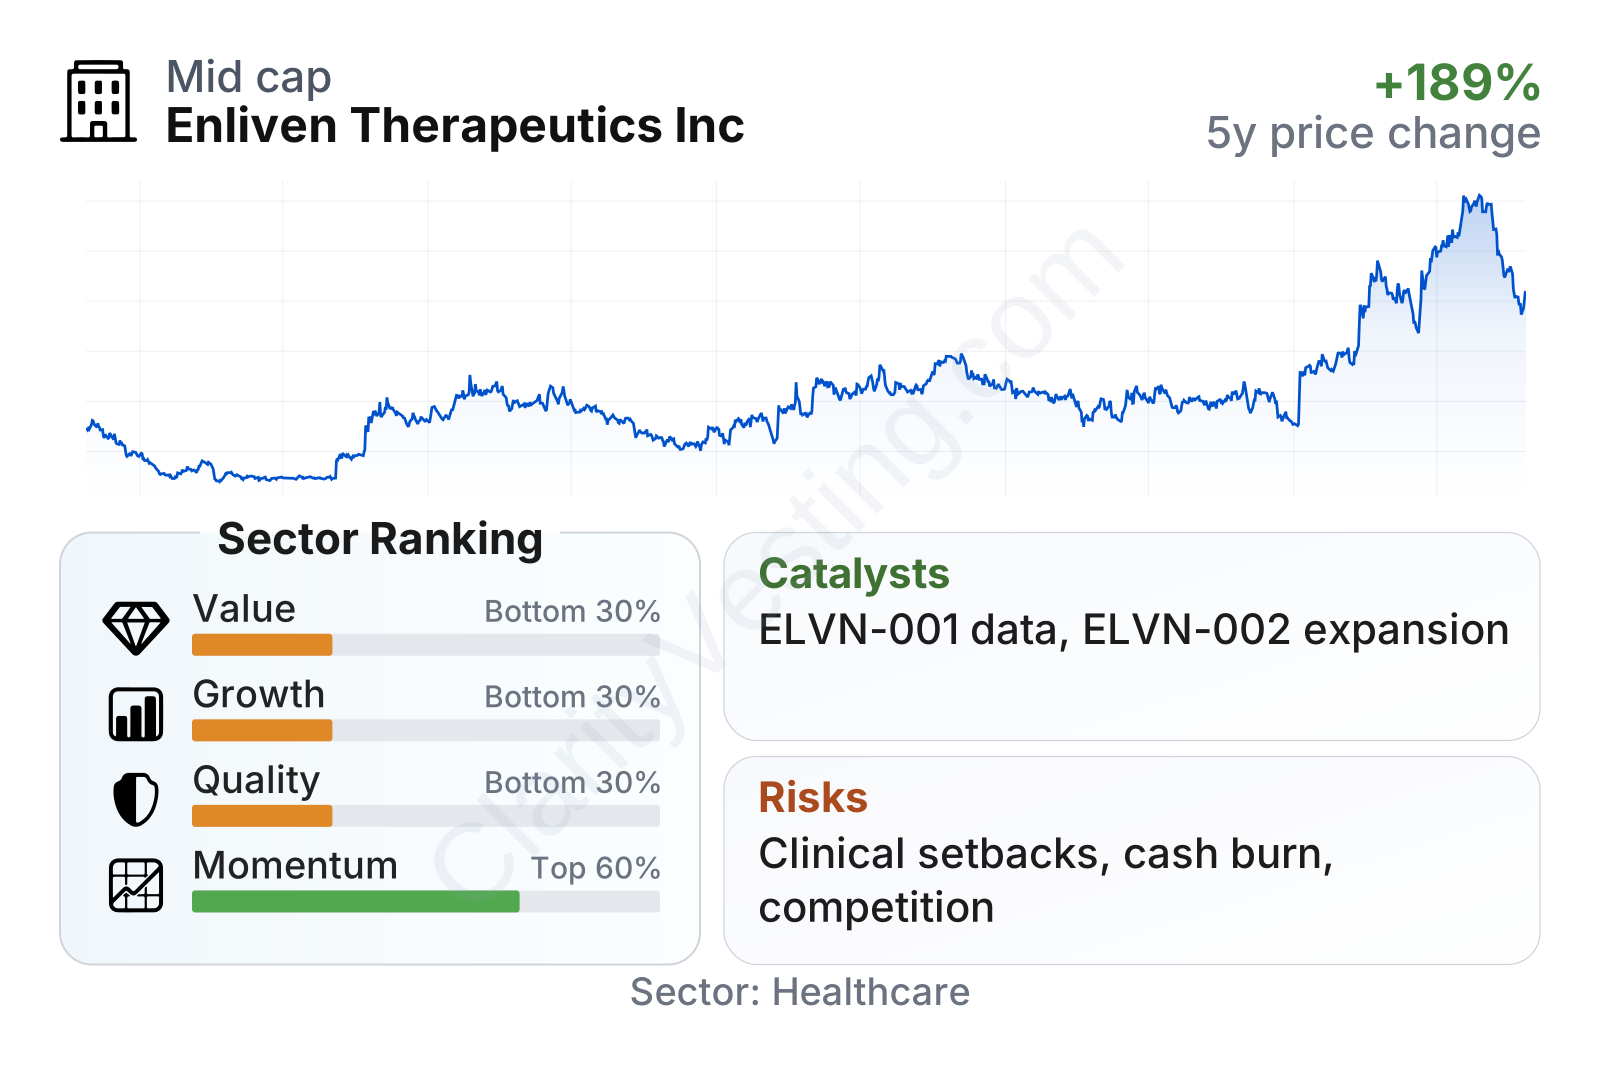
Enliven is a mid-sized biotech by market value, but financially it still behaves like a pre-commercial company. The table shows weak scores on value, growth, and quality relative to the broader healthcare sector, which is not surprising given that earnings are negative, revenue is close to zero, and cash flow remains negative. The more favorable area is market momentum: the stock has outperformed much of the sector over the last 12 months and over three years, suggesting that the market has been rewarding pipeline progress and future expectations more than current fundamentals.
The low beta also stands out. Even though biotechnology is often volatile, Enliven’s measured sensitivity to overall market moves is low, which suggests that company-specific clinical milestones matter more than broad index swings.
Growth
The company operates in one of the most active parts of healthcare: targeted oncology. This remains a growing area because cancer treatment is increasingly moving toward precision medicine, where drugs are matched to molecular drivers rather than used in a one-size-fits-all way. That broader industry direction supports Enliven’s strategy.
Its approach also makes strategic sense. Instead of trying to build a broad platform with many unrelated programs, Enliven is concentrating on a limited number of targeted assets where management believes drug design can improve selectivity, resistance coverage, and tolerability. If successful, that can create value even before commercialization through partnerships, licensing, or acquisition interest, in addition to potential future product launches.
ELVN-001 is one of the clearer growth drivers because chronic myeloid leukemia is a well-understood market with established treatment pathways, but there is still room for improved therapies, especially around safety, tolerability, and resistance. ELVN-002 expands the opportunity into HER2-driven cancers, a much broader commercial category. If clinical data continue to mature well, the company could move from being viewed as a single-asset biotech to a multi-program oncology developer with larger addressable markets.
Recent company updates in 2026 have kept attention on clinical progress, including continued advancement of both lead programs and additional data-readout expectations. For a company at this stage, those milestones are the main catalysts because positive efficacy and safety signals can reshape expected future revenue far more quickly than normal operating trends would.
Cash generation remains negative, which is expected at this stage, but the recent pattern suggests heavy investment rather than a collapsing business model. Free cash outflow has been elevated over the last few years, then improved modestly in the latest trailing period. That does not remove financing risk, but it does indicate that cash burn has not been spiraling out of control while the company pushes its core programs forward.
Risks
This article is for informational purposes only and does not constitute financial advice. Some content is AI-generated. See Disclaimer


