Stock Analysis · Elemental Royalty Corporation (ELE)
Overview
Elemental Royalty Corporation is a precious-metals royalty company focused mainly on gold. Instead of building and operating mines itself, it provides capital to mining companies and receives a contractual share of future mine revenue or production. This business model is generally lighter in operating risk than running mines directly because the royalty owner does not usually pay the day-to-day mining costs once the agreement is in place.
The company’s portfolio is spread across royalties, streams, and similar interests tied to producing mines, development projects, and exploration-stage assets. In practical terms, Elemental’s cash flow depends on how much metal is produced at the mines underlying its agreements, the market prices of gold and other metals, and whether new projects in its portfolio move into production.
Its revenue base is still concentrated, which matters for a company of this size. Based on recent company reporting, the largest contributors come from a limited number of producing assets, with the rest coming from a longer tail of smaller royalties and streams.
- Producing royalties and streams: the large majority of current revenue, estimated at more than 90%. These are the assets already generating payments from operating mines.
- Gold-linked assets: the dominant commodity exposure, estimated at well above 80% of current revenue. This reflects the company’s focus on gold royalties.
- Other metals and by-product exposure: a smaller share, coming from assets linked to commodities such as copper or silver where applicable.
- Development-stage optionality: little direct current revenue, but potentially meaningful future value if construction and ramp-up milestones are achieved at key projects.
Over the last several years, the business has shifted from a small portfolio with modest revenue into a more meaningful royalty platform. Revenue has expanded sharply, gross profit has increased, and interest expense has fallen materially, showing the effect of both portfolio growth and balance-sheet improvement. The remaining challenge is that accounting profit and free cash flow have been more uneven than top-line growth.
The long-term pattern is favorable: revenue has climbed from the low single-digit millions earlier in the decade to more than $40 million in 2025, while financing costs have dropped significantly. That combination suggests a business becoming more scalable, even if earnings have not yet settled into a consistently strong pattern.
Key Figures
| Metric | Value | Sector ⓘ |
|---|---|---|
| Date | Oct 17, 2026 | |
| Context | ||
| Sector | Basic Materials | |
| Industry | Gold | |
| Market Cap ⓘ | $1.30B | |
| Beta ⓘ | 0.60 | |
Value (Cheapness) | ||
| P/E Ratio ⓘ | N/A | 16.90 |
| P/B Ratio ⓘ | 1.33 | 1.65 |
| FCF Yield ⓘ | -1.81% | 5.76% |
| Dividend Yield ⓘ | 0.71% | 2.13% |
| EBIT / EV ⓘ | 0.82% | 6.30% |
| PEG ⓘ | N/A | |
Growth (Business expansion) | ||
| Revenue Growth ⓘ | 161.60% | 11.10% |
| RPS Growth (5Y CAGR) ⓘ | 8.55% | 4.49% |
| EPS Growth (5Y CAGR) ⓘ | N/A | -13.47% |
| BVPS Growth (5Y CAGR) ⓘ | 34.33% | 5.51% |
| Margin Growth (5Y Trend) ⓘ | 20.60% | -1.54% |
| FCF Growth (5Y CAGR) ⓘ | N/A | 0.37% |
| DPS Growth (5Y CAGR) ⓘ | N/A | 6.08% |
Quality (Business durability) | ||
| ROIC (Latest) ⓘ | 0.80% | 9.26% |
| ROA (Latest) ⓘ | 0.50% | 4.91% |
| ROIC (5Y Median) ⓘ | N/A | 7.70% |
| ROA (5Y Median) ⓘ | -2.09% | 3.86% |
| Net Debt / EBIT (Latest) ⓘ | -6.13 | 1.40 |
| Net Debt / EBIT (5Y Median) ⓘ | -0.58 | 1.70 |
| Net Debt / EBITDA (Latest) ⓘ | -2.04 | 0.95 |
| Net Debt / Assets ⓘ | -8.05% | 13.69% |
| EBITDA / Interest ⓘ | 45.32 | 12.34 |
| Operating Margin (Latest) ⓘ | 17.04% | 13.20% |
| Operating Margin (5Y Median) ⓘ | 7.65% | 11.80% |
| Debt to Equity (Latest) ⓘ | N/A | 40.56% |
| Profit Margin (Latest) ⓘ | 4.01% | 6.43% |
| Free Cash Flow (Latest) ⓘ | -$23.61M | |
Momentum (Price trend) | ||
| 3Y Return ⓘ | +92.92% | +68.89% |
| 12M Return (excl. last month) ⓘ | +29.13% | +30.21% |
| 6M Return ⓘ | -22.83% | -4.16% |
| Price vs. 200-Day MA ⓘ | -16.64% | -1.27% |
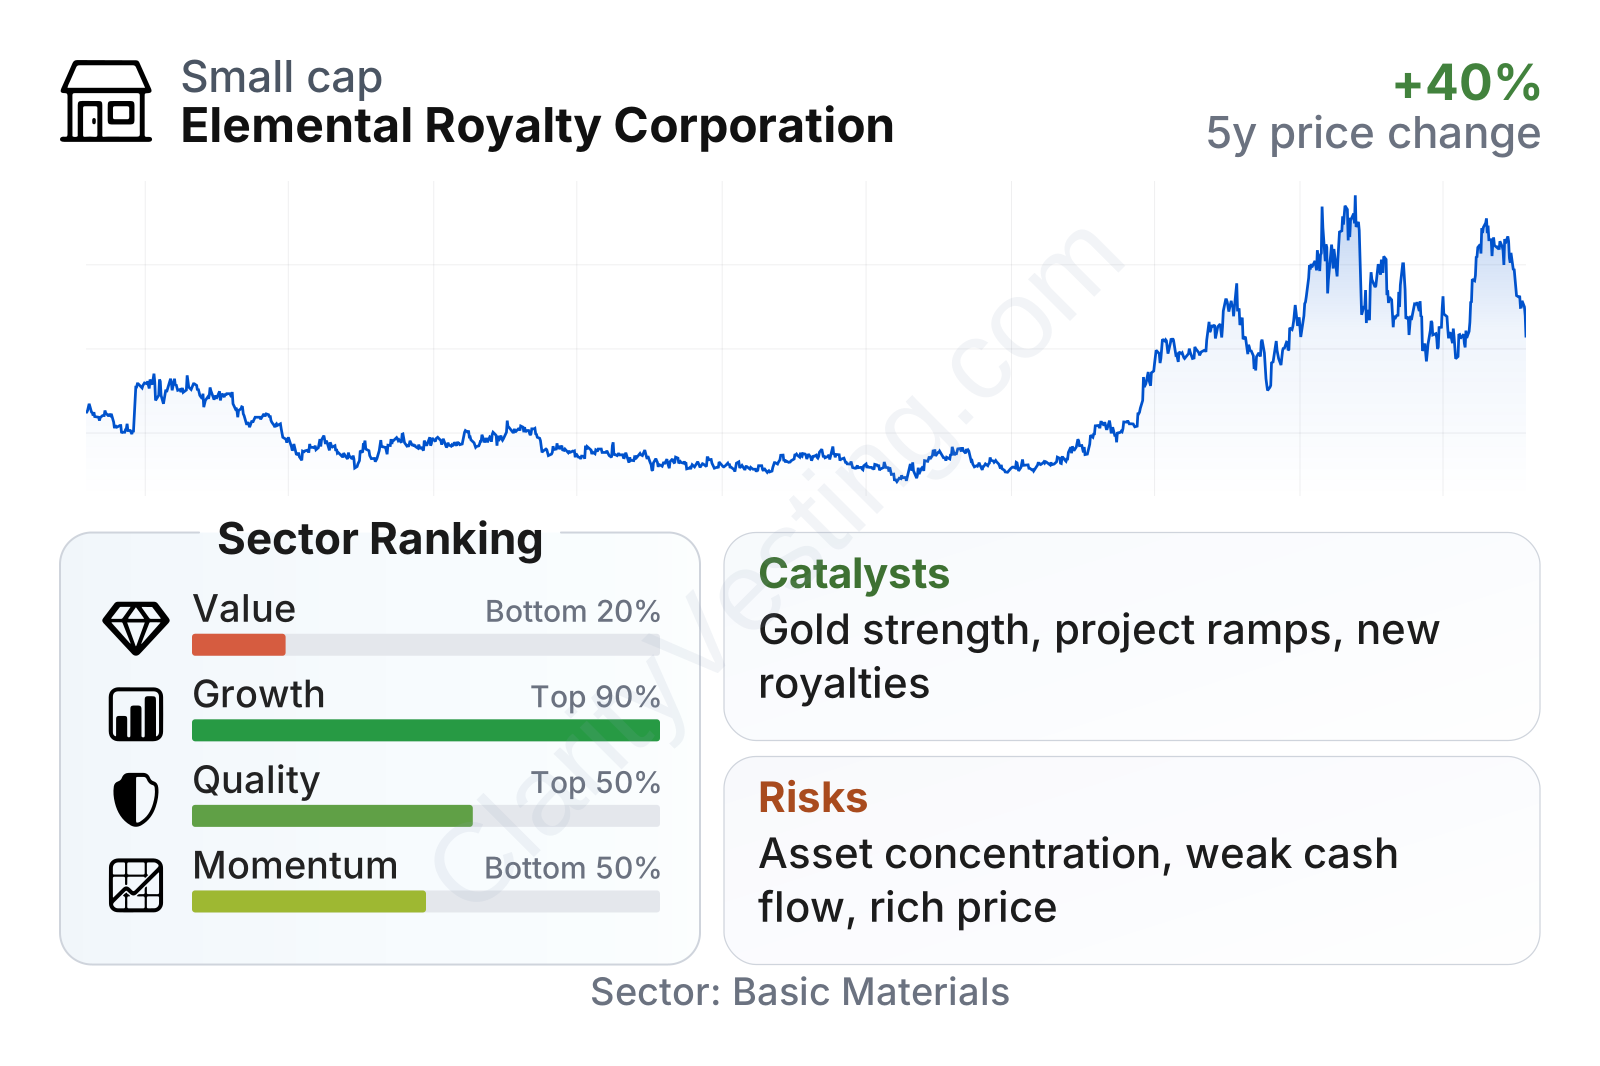
Elemental sits in the mid-cap range within its sector and has shown lower share-price volatility than the broader mining space, with a beta around 0.55. The factor profile is mixed but easy to interpret: growth ranks very strongly versus the sector, quality is around the middle, momentum is also around the middle to somewhat better, while value ranks weakly. In other words, the market appears to be paying for expansion and portfolio optionality, not for current earnings strength or cash generation.
That split is visible in the underlying metrics. Revenue growth has been far ahead of the sector, operating margins are above the industry median, and leverage is very conservative. On the other hand, returns on capital remain low, free cash flow is negative on a trailing basis, and the dividend is minimal. This is a company that looks financially safer than many miners, but not yet as productive as larger, more mature royalty peers.
Growth
Elemental operates in a part of the mining sector that has attractive long-term features. Royalty companies can grow without taking on the full operating complexity of mine ownership, and they often benefit from inflation in metal prices while avoiding many direct cost overruns at the mine level. Gold itself continues to have structural support from central-bank demand, macro uncertainty, and its role as a store of value, which gives royalty companies a useful backdrop if gold prices remain elevated.
The company’s strategy also makes sense for long-term expansion. It has been building a diversified portfolio of producing and development royalties, which creates two layers of growth: immediate cash flow from mines already operating, and delayed upside from projects that may enter production later. For a royalty company, that second layer can be especially powerful because a single major project moving into production can materially change revenue without requiring heavy follow-on capital.
Recent revenue growth has been exceptional, far above the sector median, although not perfectly smooth from quarter to quarter. The larger point is that the direction has remained upward, with several periods of very strong year-over-year expansion. That supports the view that the portfolio is moving into a more productive phase rather than merely benefiting from one-off fluctuations.
Free cash flow has been less steady than revenue, swinging from positive territory back to negative. For a royalty company, this can happen when acquisitions or portfolio additions absorb cash ahead of future income. It does not automatically weaken the business case, but it does mean growth is currently more visible in revenue than in self-funded cash generation.
One of the strongest catalysts is the company’s exposure to development assets that can become producing mines over time. Another is the broader environment for gold, where stronger prices can lift royalty receipts with limited added operating burden for Elemental. Company updates over the last year have also pointed to portfolio additions and progressing underlying assets, reinforcing the idea that future growth is not tied to a single mine alone, even though concentration remains important today.
Risks
This article is for informational purposes only and does not constitute financial advice. Some content is AI-generated. See Disclaimer


