Stock Analysis · Excelerate Energy Inc (EE)
Overview
Excelerate Energy is a U.S.-based liquefied natural gas, or LNG, infrastructure company. In simple terms, it helps countries import natural gas by sea and turn it back into usable gas through floating regasification units, often called FSRUs. These vessels can be deployed faster and with lower upfront cost than building a large land-based import terminal, which gives Excelerate a distinct role in energy markets where supply security matters and project timing is critical.
The company operates across the LNG value chain, but its business is centered on long-term infrastructure services rather than commodity production. That means its economics are tied more to contracted access to ships, terminals, and related services than to directly drilling for oil or gas. This makes the business profile different from upstream energy companies and somewhat closer to specialized midstream infrastructure.
Based on company filings, annual reports, and investor materials, revenue mainly comes from a mix of regasification capacity, vessel charters, terminal services, and LNG and natural gas sales. The exact mix can shift meaningfully from year to year because commodity sales can be more volatile than contracted service revenue.
- LNG and natural gas sales: often the largest reported revenue line in years with more trading or delivered gas volumes. This can represent a sizable majority of total revenue in some periods, but it is also the least stable source.
- Regasification services: recurring fees tied to floating LNG import infrastructure and the delivery of gas conversion capacity to customers.
- Vessel charter revenue: income from leasing FSRUs or LNG carriers under medium- to long-term contracts.
- Terminal and infrastructure services: operation and maintenance, port-related services, and other support tied to LNG import projects.
That mix matters for long-term analysis: reported revenue can move sharply when commodity-linked sales rise or fall, while the more important indicator for business durability is whether the company is adding contracted infrastructure capacity and maintaining utilization on its fleet.
The financial profile over the last several years shows this contrast clearly. Revenue has swung widely, but operating profit has held up better than headline sales, suggesting the contract-based part of the business remains the anchor. Net income, however, has stayed relatively modest because interest costs are meaningful for a company that relies on capital-intensive assets.
The broad trend is a business with lumpy sales but comparatively resilient operating earnings. Gross profit and operating income have remained solid even when total revenue declined from peak levels, which supports the view that the core infrastructure platform is more stable than the top line alone suggests.
Key Figures
| Metric | Value | Sector ⓘ |
|---|---|---|
| Date | Oct 17, 2026 | |
| Context | ||
| Sector | Energy | |
| Industry | Oil & Gas Midstream | |
| Market Cap ⓘ | $3.87B | |
| Beta ⓘ | 1.25 | |
Value (Cheapness) | ||
| P/E Ratio ⓘ | 23.51 | 15.44 |
| P/B Ratio ⓘ | 1.56 | 1.73 |
| FCF Yield ⓘ | -5.62% | 8.20% |
| Dividend Yield ⓘ | 0.94% | 3.59% |
| EBIT / EV ⓘ | 18.74% | 7.46% |
| PEG ⓘ | N/A | |
Growth (Business expansion) | ||
| Revenue Growth ⓘ | 61.00% | 26.90% |
| RPS Growth (5Y CAGR) ⓘ | 1.87% | 6.90% |
| EPS Growth (5Y CAGR) ⓘ | -34.58% | -15.73% |
| BVPS Growth (5Y CAGR) ⓘ | -16.99% | 6.07% |
| Margin Growth (5Y Trend) ⓘ | 7.42% | 0.58% |
| FCF Growth (5Y CAGR) ⓘ | 29.66% | 1.86% |
| DPS Growth (5Y CAGR) ⓘ | 49.92% | 16.79% |
Quality (Business durability) | ||
| ROIC (Latest) ⓘ | 16.26% | 11.40% |
| ROA (Latest) ⓘ | 1.15% | 6.06% |
| ROIC (5Y Median) ⓘ | 18.20% | 10.30% |
| ROA (5Y Median) ⓘ | 1.12% | 5.42% |
| Net Debt / EBIT (Latest) ⓘ | 3.11 | 1.64 |
| Net Debt / EBIT (5Y Median) ⓘ | 1.19 | 1.83 |
| Net Debt / EBITDA (Latest) ⓘ | 2.13 | 1.08 |
| Net Debt / Assets ⓘ | 25.14% | 17.29% |
| EBITDA / Interest ⓘ | 4.44 | 9.64 |
| Operating Margin (Latest) ⓘ | 22.88% | 16.27% |
| Operating Margin (5Y Median) ⓘ | 19.59% | 20.39% |
| Debt to Equity (Latest) ⓘ | 202.74% | 54.76% |
| Profit Margin (Latest) ⓘ | 3.23% | 8.82% |
| Free Cash Flow (Latest) ⓘ | -$217.15M | |
Momentum (Price trend) | ||
| 3Y Return ⓘ | +123.41% | +67.38% |
| 12M Return (excl. last month) ⓘ | +58.64% | +49.19% |
| 6M Return ⓘ | +0.13% | +7.07% |
| Price vs. 200-Day MA ⓘ | -7.08% | +9.56% |
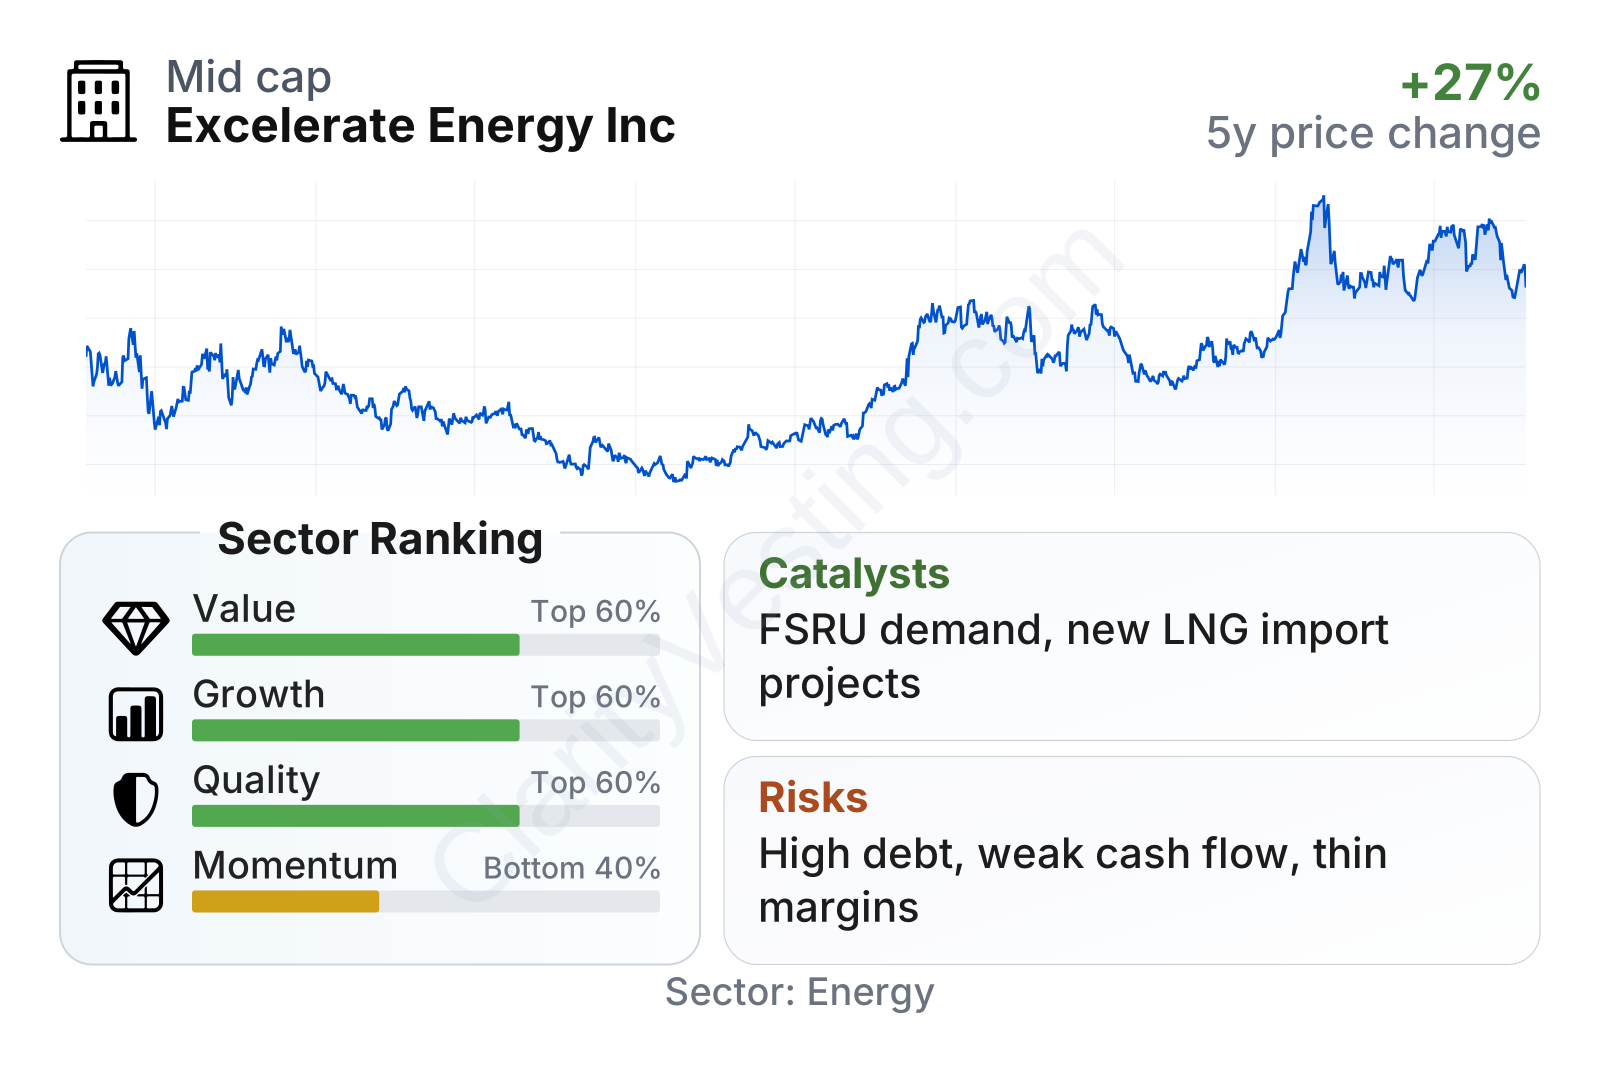
Excelerate Energy is a mid-sized energy infrastructure company with a stock that has been volatile since listing but has also delivered a strong multi-year price recovery. In the latest comparative metrics, the company ranks around the middle of the sector on value, growth, and quality, while recent market momentum is weaker. Profitability at the operating level looks healthy relative to many peers, but free cash flow is currently negative and leverage is noticeably above sector norms. The valuation picture is mixed: earnings and dividend measures look less appealing than the sector median, while enterprise-value-based measures are stronger.
Growth
Excelerate operates in a sector with favorable long-term demand drivers. Many countries want more flexible gas import capacity to improve energy security, diversify supply away from pipeline dependence, and support rising electricity demand. Floating LNG import solutions have become especially relevant because they can usually be deployed faster than land-based terminals. That gives the company exposure to an expanding niche within global gas infrastructure.
The company’s strategy is also coherent for that backdrop. It combines specialized vessels, operating experience, and project development capabilities. This is important because governments and utilities often want a single partner that can supply the ship, connect it to an import solution, and operate the system. That integrated model can strengthen customer relationships and raise switching costs once a project is running.
Recent revenue growth has rebounded sharply after a period of contraction. That recovery shows the business can return to expansion when new projects, higher utilization, or more gas marketing activity come through. At the same time, the pattern also confirms that growth is not smooth from quarter to quarter, so long-term assessment should focus more on contract wins and asset deployment than on any single annual growth rate.
Free cash flow has been uneven, which is common in asset-heavy infrastructure businesses. Large project spending can push cash generation negative in some periods even when accounting earnings remain positive. For Excelerate, that makes the key question whether current spending is supporting future contracted earnings rather than simply covering the existing base.
One important catalyst has been the global push to secure LNG access outside traditional supply routes. Since the European energy shock and broader concerns about supply reliability, more countries have accelerated floating import projects. Excelerate’s fleet and operational track record place it in a position to benefit when countries need relatively fast import solutions.
Recent company communications have also highlighted progress on new project development and international expansion opportunities, especially in markets that need import infrastructure but want to avoid the cost and long lead times of permanent onshore terminals. For a business of this size, even a small number of successful new contracts can make a visible difference to future revenue and earnings.
Risks
This article is for informational purposes only and does not constitute financial advice. Some content is AI-generated. See Disclaimer


