Stock Analysis · Edenred Malakoff (EDNMY)
Overview
Edenred is a French digital payments and employee benefits company best known for meal vouchers, but its business is much broader than that. It provides prepaid corporate payment solutions used by employers, merchants, fleet operators, and public-sector organizations. In practical terms, Edenred helps companies distribute employee benefits, manage business expenses, and pay for mobility-related services through cards, mobile apps, and digital platforms.
The group organizes its business around three main families of services, with employee benefits remaining the largest contributor. Based on the company’s recent annual reporting, revenue is broadly split as follows:
- Employee Benefits: about 60% of revenue. This includes meal benefits, food-related vouchers, gift solutions, employee engagement tools, and other quality-of-life-at-work products.
- Mobility: about 25% of revenue. This covers fleet and mobility solutions such as fuel cards, electric vehicle charging, tolls, maintenance, and business travel-related payments.
- Complementary Solutions: about 15% of revenue. This includes corporate payment services, expense management, virtual cards, and other business-to-business payment tools.
Edenred’s model has two attractive characteristics for long-term analysis. First, a meaningful share of activity is recurring because employers reload benefits regularly and fleet clients use payment tools every day. Second, the company can earn not only service fees but also float-related income on stored funds in some markets, which can support profitability when interest rates are favorable.
Geographically, Edenred is diversified across Europe, Latin America, and other international markets, which reduces dependence on a single economy but also exposes results to currency moves and local regulation. The business is no longer a paper-voucher operator at its core; it has spent years shifting toward digital issuance, platform services, and embedded payments.
The multi-year financial flow also shows a business that expanded revenue strongly from 2021 to 2024, while operating income improved meaningfully. The latest annual comparison is less smooth, with revenue and operating income easing from the prior year and interest expense rising sharply, which is a reminder that Edenred’s earnings path can be affected by financing costs and business mix.
Key Figures
| Metric | Value | Sector ⓘ |
|---|---|---|
| Date | Oct 03, 2026 | |
| Context | ||
| Sector | Financial Services | |
| Industry | Credit Services | |
| Market Cap ⓘ | $4.93B | |
| Beta ⓘ | 0.68 | |
Value (Cheapness) | ||
| P/E Ratio ⓘ | 9.27 | 12.60 |
| P/B Ratio ⓘ | N/A | 1.23 |
| FCF Yield ⓘ | 31.42% | 10.16% |
| Dividend Yield ⓘ | 4.91% | 2.96% |
| EBIT / EV ⓘ | N/A | 7.77% |
| PEG ⓘ | 1.56 | |
Growth (Business expansion) | ||
| Revenue Growth ⓘ | 1.50% | 9.50% |
| RPS Growth (5Y CAGR) ⓘ | 16.28% | 12.10% |
| EPS Growth (5Y CAGR) ⓘ | 7.68% | -9.45% |
| BVPS Growth (5Y CAGR) ⓘ | N/A | 5.01% |
| Margin Growth (5Y Trend) ⓘ | 0.29% | -4.07% |
| FCF Growth (5Y CAGR) ⓘ | 15.28% | 4.96% |
| DPS Growth (5Y CAGR) ⓘ | 50.30% | 8.79% |
Quality (Business durability) | ||
| ROIC (Latest) ⓘ | N/A | 9.60% |
| ROE (Latest) ⓘ | N/A | 13.84% |
| ROA (Latest) ⓘ | 7.25% | 1.53% |
| ROIC (5Y Median) ⓘ | 16.83% | 7.86% |
| ROE (5Y Median) ⓘ | N/A | 12.20% |
| ROA (5Y Median) ⓘ | 3.59% | 1.29% |
| Net Debt / EBIT (Latest) ⓘ | 1.00 | 0.91 |
| Net Debt / EBIT (5Y Median) ⓘ | 1.12 | 0.74 |
| Net Debt / EBITDA (Latest) ⓘ | 0.76 | 0.97 |
| Operating Margin (Latest) ⓘ | 29.65% | 22.12% |
| Operating Margin (5Y Median) ⓘ | 31.33% | 24.39% |
| Debt to Equity (Latest) ⓘ | -497.25% | 60.37% |
| Profit Margin (Latest) ⓘ | 18.16% | 26.62% |
| Free Cash Flow (Latest) ⓘ | $1.55B | |
Momentum (Price trend) | ||
| 3Y Return ⓘ | -37.48% | +89.23% |
| 12M Return (excl. last month) ⓘ | +28.85% | +17.35% |
| 6M Return ⓘ | +62.61% | +10.00% |
| Price vs. 200-Day MA ⓘ | +21.42% | +3.73% |
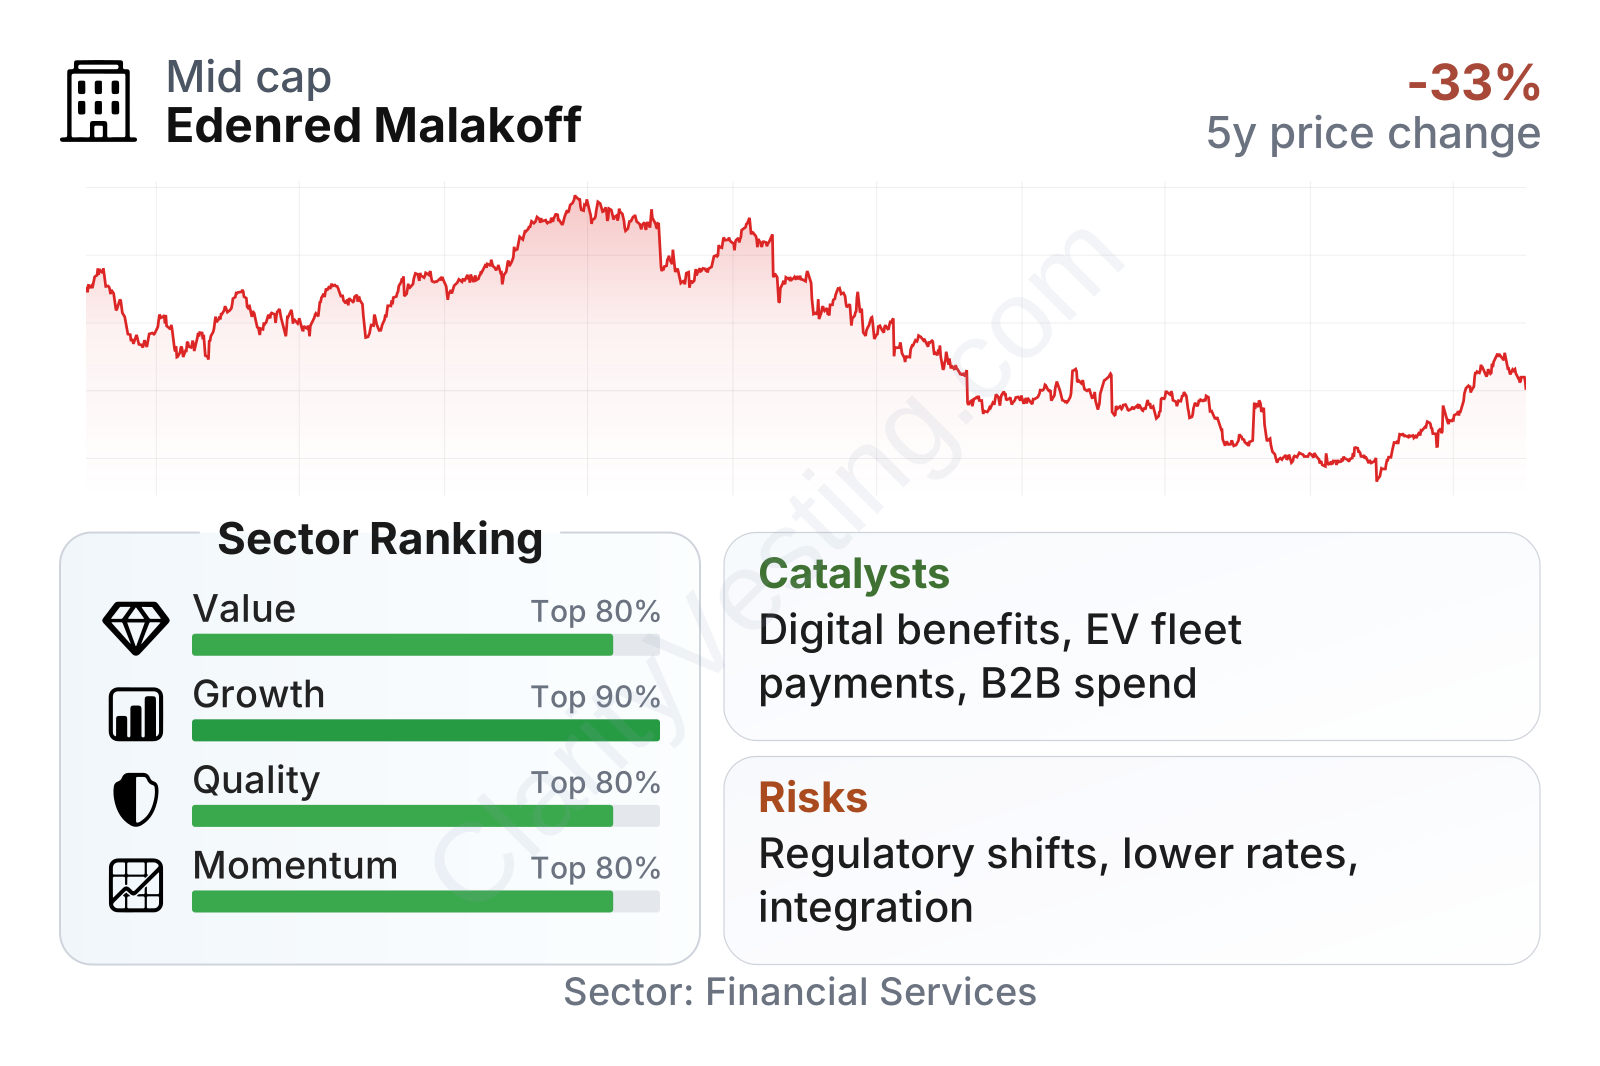
Edenred sits in the larger end of the mid-cap range and shows an unusually mixed profile: strong profitability and cash generation, but a stock that still carries the mark of a weak multi-year share-price period. Valuation multiples look lower than the sector median on earnings, while free cash flow yield and dividend yield are both notably stronger than typical peers. Profitability metrics are also solid, with operating margins above the sector median and returns on assets comfortably ahead of many financial-services companies.
Balance-sheet interpretation needs care. Net debt relative to EBITDA looks manageable, but book equity is negative, so measures such as debt-to-equity are not very informative here. Momentum has turned positive more recently, with the shares rebounding sharply over six and twelve months, even though the three-year stock return remains clearly negative.
Growth
Edenred operates in segments with structural tailwinds. Employee benefits continue to benefit from the formalization of labor markets, the digitization of meal and welfare programs, and employer demand for retention and engagement tools. Mobility is also changing in a way that supports more sophisticated payment platforms, especially as fleet managers need integrated tools for fuel, charging, tolling, and expense tracking. Corporate payments and expense management add another growth layer because companies are still replacing manual reimbursement and fragmented payment processes with digital workflows.
The strategy is broadly coherent. Edenred has been building ecosystems where employers, employees, merchants, and corporate clients are all connected on the same platform. That creates switching costs, supports recurring transaction volume, and allows the company to cross-sell adjacent services. Acquisitions have also been part of the playbook, especially in fleet and business payments, where scale and network reach matter.
One important catalyst is the continued move from paper-based or local solutions to digital and mobile formats. Another is the expansion of B2B payment use cases, where Edenred can leverage its installed base to add virtual cards, expense automation, and broader working-capital tools. In mobility, electrification can become a real opportunity because fleet clients increasingly need a single interface that handles both fuel and EV charging rather than separate systems.
Recent operating progress has not been linear, but the longer record still points to expansion. Over the last five years, revenue per share growth and free cash flow growth have run ahead of the sector median, and operating margins have held up better than many peers. That suggests Edenred has had real discipline in turning growth into cash rather than pursuing volume at any cost.
The earnings trend improved recently, with the latest annual EPS level above the prior year shown here. That matters because Edenred’s current valuation is being judged not only on revenue expansion but also on whether it can sustain margin quality after a period of higher interest expense and some normalization in activity.
Book value per share remains negative, which is not unusual for some payment and platform businesses after acquisitions, buybacks, or accounting effects, but it does mean equity-based measures should not be treated as a clean signal of operating strength. For this company, cash generation and operating profit are more useful indicators than stated book value.
Risks
This article is for informational purposes only and does not constitute financial advice. Some content is AI-generated. See Disclaimer


