Stock Analysis · Everus Construction Group Inc (ECG)
Overview
Everus Construction Group Inc operates in specialty contracting and infrastructure services within the broader engineering and construction industry. The company works on complex projects tied to electric power, communications, industrial facilities, and related infrastructure. In practical terms, Everus helps build and maintain the systems that move electricity, connect telecom networks, and support large industrial sites. Its work is usually project-based, which means revenue depends on winning contracts, executing them well, and keeping a healthy backlog of future work.
The company’s revenue is mainly generated from specialty construction services rather than from manufacturing or recurring software-like income. Based on the company’s public filings and business description, the mix is best understood through its end markets and service lines rather than a large number of separate product categories.
- Electrical infrastructure and utility-related work – likely the largest source of revenue. This includes transmission, distribution, substation, and other grid-related construction and maintenance services for utilities and energy customers.
- Industrial construction and maintenance – a major contributor. This includes electrical, mechanical, and related field services for industrial plants, manufacturing sites, and other large facilities.
- Communications and network infrastructure – a smaller but meaningful activity. This generally includes fiber, telecom, and related connectivity buildouts.
- Other specialty services – a smaller portion tied to adjacent contracting and support activities.
Public disclosures do not appear to provide a clean percentage split for each of these buckets in the material available here, so a precise ranked breakdown by percentage would risk overstating certainty. What is clear is that Everus is exposed to essential infrastructure spending, especially areas linked to grid investment and industrial project activity.
From a financial flow perspective, the business has expanded strongly over the last several years. Revenue climbed from about $2.1 billion in 2021 to roughly $3.7 billion in 2025, while operating income and net income also moved higher. Gross profit improved over that period, suggesting that growth has not come only from taking on more volume, but also from maintaining a workable spread above project costs.
The long-term pattern shows a business that has scaled up meaningfully, with profitability improving in absolute dollars even though construction remains a cost-heavy industry where most revenue is absorbed by labor, materials, subcontracting, and project execution expenses.
Key Figures
| Metric | Value | Sector ⓘ |
|---|---|---|
| Date | Oct 24, 2026 | |
| Context | ||
| Sector | Industrials | |
| Industry | Engineering & Construction | |
| Market Cap ⓘ | $5.40B | |
| Beta ⓘ | N/A | |
Value (Cheapness) | ||
| P/E Ratio ⓘ | 21.89 | 22.29 |
| P/B Ratio ⓘ | 7.02 | 1.98 |
| FCF Yield ⓘ | 4.64% | 6.26% |
| Dividend Yield ⓘ | N/A | 1.92% |
| EBIT / EV ⓘ | 5.87% | 4.83% |
| PEG ⓘ | N/A | |
Growth (Business expansion) | ||
| Revenue Growth ⓘ | 33.70% | 9.30% |
| RPS Growth (5Y CAGR) ⓘ | 16.13% | 7.76% |
| EPS Growth (5Y CAGR) ⓘ | 42.91% | -13.17% |
| BVPS Growth (5Y CAGR) ⓘ | 17.96% | 6.13% |
| Margin Growth (5Y Trend) ⓘ | 0.70% | 0.74% |
| FCF Growth (5Y CAGR) ⓘ | 11.53% | 10.79% |
| DPS Growth (5Y CAGR) ⓘ | N/A | 9.41% |
Quality (Business durability) | ||
| ROIC (Latest) ⓘ | 28.01% | 10.75% |
| ROA (Latest) ⓘ | 13.82% | 5.41% |
| ROIC (5Y Median) ⓘ | N/A | 9.37% |
| ROA (5Y Median) ⓘ | 12.54% | 4.95% |
| Net Debt / EBIT (Latest) ⓘ | 0.53 | 2.04 |
| Net Debt / EBIT (5Y Median) ⓘ | 1.31 | 2.27 |
| Net Debt / EBITDA (Latest) ⓘ | 0.48 | 1.39 |
| Net Debt / Assets ⓘ | 9.11% | 19.27% |
| EBITDA / Interest ⓘ | 21.31 | 9.58 |
| Operating Margin (Latest) ⓘ | 8.34% | 10.49% |
| Operating Margin (5Y Median) ⓘ | 6.84% | 10.30% |
| Debt to Equity (Latest) ⓘ | 47.10% | 64.82% |
| Profit Margin (Latest) ⓘ | 5.96% | 6.67% |
| Free Cash Flow (Latest) ⓘ | $250.37M | |
Momentum (Price trend) | ||
| 3Y Return ⓘ | N/A | +67.77% |
| 12M Return (excl. last month) ⓘ | +42.00% | +12.05% |
| 6M Return ⓘ | -17.88% | 0.00% |
| Price vs. 200-Day MA ⓘ | -15.44% | +0.67% |
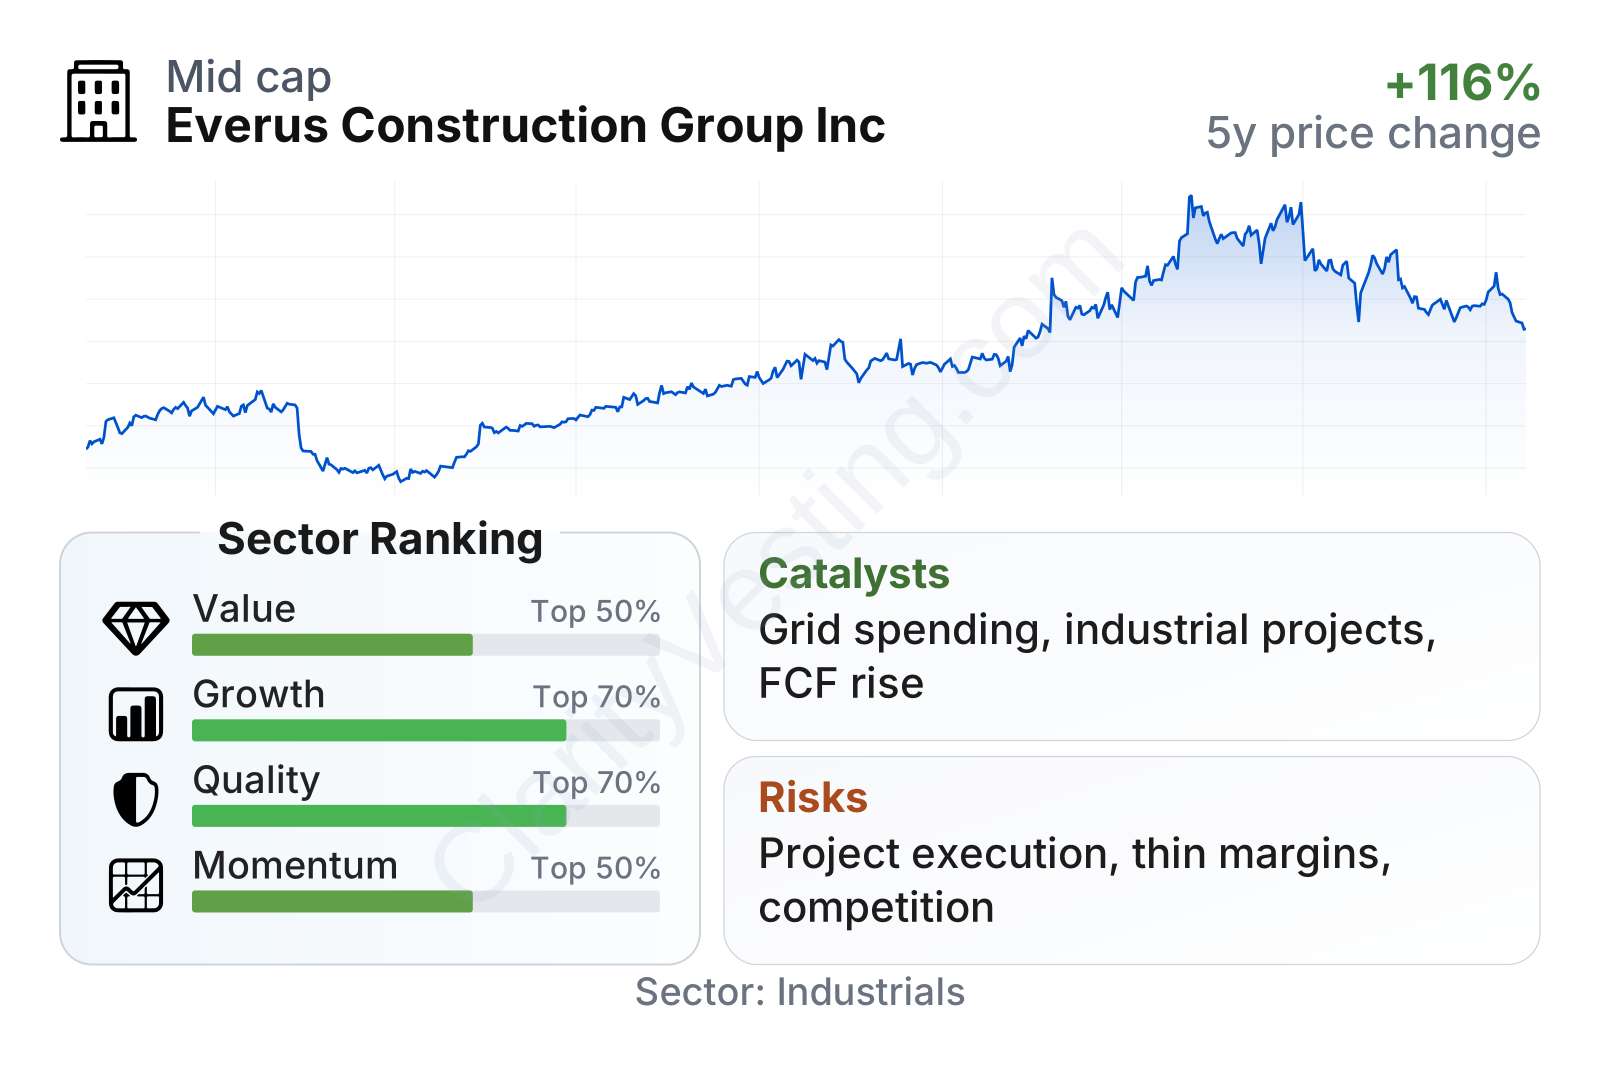
Everus sits in the mid-cap range, large enough to matter in its niche but still much smaller than the biggest diversified engineering and construction groups. The overall profile is mixed in a constructive way: growth and capital efficiency stand out, while valuation is no longer especially low after the stock’s strong move. Return on invested capital and return on assets are well above typical sector levels, and balance-sheet leverage looks moderate rather than stretched. At the same time, the price-to-book multiple is far above the industry median, which suggests the market is already assigning a premium to the company’s execution and growth prospects.
Growth
Everus operates in a part of the market with supportive long-term demand drivers. Electric grid expansion, grid hardening, utility modernization, data and connectivity needs, industrial investment, and domestic infrastructure spending all create a favorable backdrop for specialty contractors with the right labor force and customer relationships. This does not make growth automatic, but it does mean the company is not dependent on a shrinking or obsolete market.
The recent operating trend is notably strong. Revenue growth has been running around the mid-20% to mid-30% range year over year in recent quarters, clearly above the sector median. Over a longer period, five-year revenue-per-share growth and earnings-per-share growth have also been stronger than typical peers. That matters because it suggests expansion is not limited to one unusually strong quarter.
The strategy also makes sense for this stage of the cycle. Everus is focused on specialized, difficult-to-replicate field work rather than commoditized construction alone. In infrastructure services, customers often care about safety, reliability, skilled labor availability, and proven execution. Those are areas where established contractors can build durable positions over time. If utility and industrial customers continue to increase capital spending, companies with available crews and operational discipline can grow faster than the broader construction market.
Cash generation has also been improving, which is an important sign in a project-based business. Free cash flow moved up meaningfully from the 2025 level shown to the more recent trailing figure, indicating that accounting earnings are increasingly being backed by actual cash.
A current catalyst is the broad wave of North American power and industrial investment. Utilities are spending to upgrade transmission and distribution networks, while manufacturing and energy-related projects continue to support demand for electrical and mechanical specialty contractors. Everus appears well placed to benefit if these spending programs remain active, especially because its recent growth has already shown that end-market demand is translating into revenue.
Another positive point is the stock’s earlier price strength over the last year, which reflects improving market recognition of the business. While share-price momentum is not a business fundamental by itself, it often follows stronger earnings, backlog, or margin confidence in companies like this.
Risks
This article is for informational purposes only and does not constitute financial advice. Some content is AI-generated. See Disclaimer


