Stock Analysis · EBOS Group Limited (EBOSY)
Overview
EBOS Group Limited is a healthcare and animal care distribution company based in Australasia. Its core role is practical rather than high-tech: it moves medicines, medical products, and veterinary supplies from manufacturers to pharmacies, hospitals, clinics, and retailers. That makes it an important part of the healthcare supply chain in Australia and New Zealand, where reliability, scale, and customer relationships matter more than brand visibility with consumers.
The group operates through two main divisions. Healthcare is the larger business and includes pharmaceutical wholesaling, hospital and pharmacy services, medical consumables, and related logistics. Animal Care is the second pillar and includes wholesale distribution of veterinary products, pet care products, and services tied to companion animals and production animals.
Based on recent annual reporting, revenue is heavily concentrated in Healthcare, with Animal Care providing a meaningful but much smaller contribution.
- Healthcare: about 85% to 90% of group revenue. This includes pharmaceutical distribution, medical and surgical product supply, hospital services, community pharmacy support, and logistics.
- Animal Care: about 10% to 15% of group revenue. This includes veterinary medicines, pet products, and distribution services to clinics, retailers, and rural customers.
That mix matters because healthcare distribution usually produces very large sales volumes but thin margins. In other words, EBOS can generate billions in revenue while keeping only a small percentage as operating profit. This is normal for the business model, but it also means execution, working capital discipline, and financing costs are critical.
The multi-year operating picture shows a company with strong scale and generally rising revenue, but with recent pressure on profitability. Sales expanded from roughly the low-$10 billion range a few years ago to above $13 billion recently, while operating income and net income have been less steady. Gross profit had improved through 2025, then appears weaker in the latest period, while interest expense has trended higher over time. That combination suggests growth in activity has not translated cleanly into stronger margins.
Key Figures
| Metric | Value | Sector ⓘ |
|---|---|---|
| Date | Oct 24, 2026 | |
| Context | ||
| Sector | Healthcare | |
| Industry | Medical Distribution | |
| Market Cap ⓘ | $2.06B | |
| Beta ⓘ | 0.17 | |
Value (Cheapness) | ||
| P/E Ratio ⓘ | 12.68 | 25.42 |
| P/B Ratio ⓘ | 0.36 | 3.08 |
| FCF Yield ⓘ | 24.93% | 3.12% |
| Dividend Yield ⓘ | 7.17% | 1.85% |
| EBIT / EV ⓘ | N/A | 0.56% |
| PEG ⓘ | 4.52 | |
Growth (Business expansion) | ||
| Revenue Growth ⓘ | 7.10% | 7.50% |
| RPS Growth (5Y CAGR) ⓘ | 1.22% | 8.60% |
| EPS Growth (5Y CAGR) ⓘ | 0.09% | -17.73% |
| BVPS Growth (5Y CAGR) ⓘ | 1.36% | 3.72% |
| Margin Growth (5Y Trend) ⓘ | -0.16% | -0.57% |
| FCF Growth (5Y CAGR) ⓘ | 4.80% | 0.96% |
| DPS Growth (5Y CAGR) ⓘ | -9.83% | 6.69% |
Quality (Business durability) | ||
| ROIC (Latest) ⓘ | N/A | 3.17% |
| ROA (Latest) ⓘ | 6.05% | 2.98% |
| ROIC (5Y Median) ⓘ | N/A | 4.56% |
| ROA (5Y Median) ⓘ | 4.01% | 1.87% |
| Net Debt / EBIT (Latest) ⓘ | 2.11 | 1.34 |
| Net Debt / EBIT (5Y Median) ⓘ | N/A | 1.86 |
| Net Debt / EBITDA (Latest) ⓘ | 1.49 | 1.00 |
| Net Debt / Assets ⓘ | 21.18% | 5.06% |
| EBITDA / Interest ⓘ | 4.64 | 9.55 |
| Operating Margin (Latest) ⓘ | 3.03% | 9.25% |
| Operating Margin (5Y Median) ⓘ | 3.19% | 7.33% |
| Debt to Equity (Latest) ⓘ | 68.98% | 26.68% |
| Profit Margin (Latest) ⓘ | 1.67% | 3.34% |
| Free Cash Flow (Latest) ⓘ | $512.41M | |
Momentum (Price trend) | ||
| 3Y Return ⓘ | -30.94% | +51.61% |
| 12M Return (excl. last month) ⓘ | -41.73% | +19.90% |
| 6M Return ⓘ | -23.37% | +10.10% |
| Price vs. 200-Day MA ⓘ | -29.80% | +6.44% |
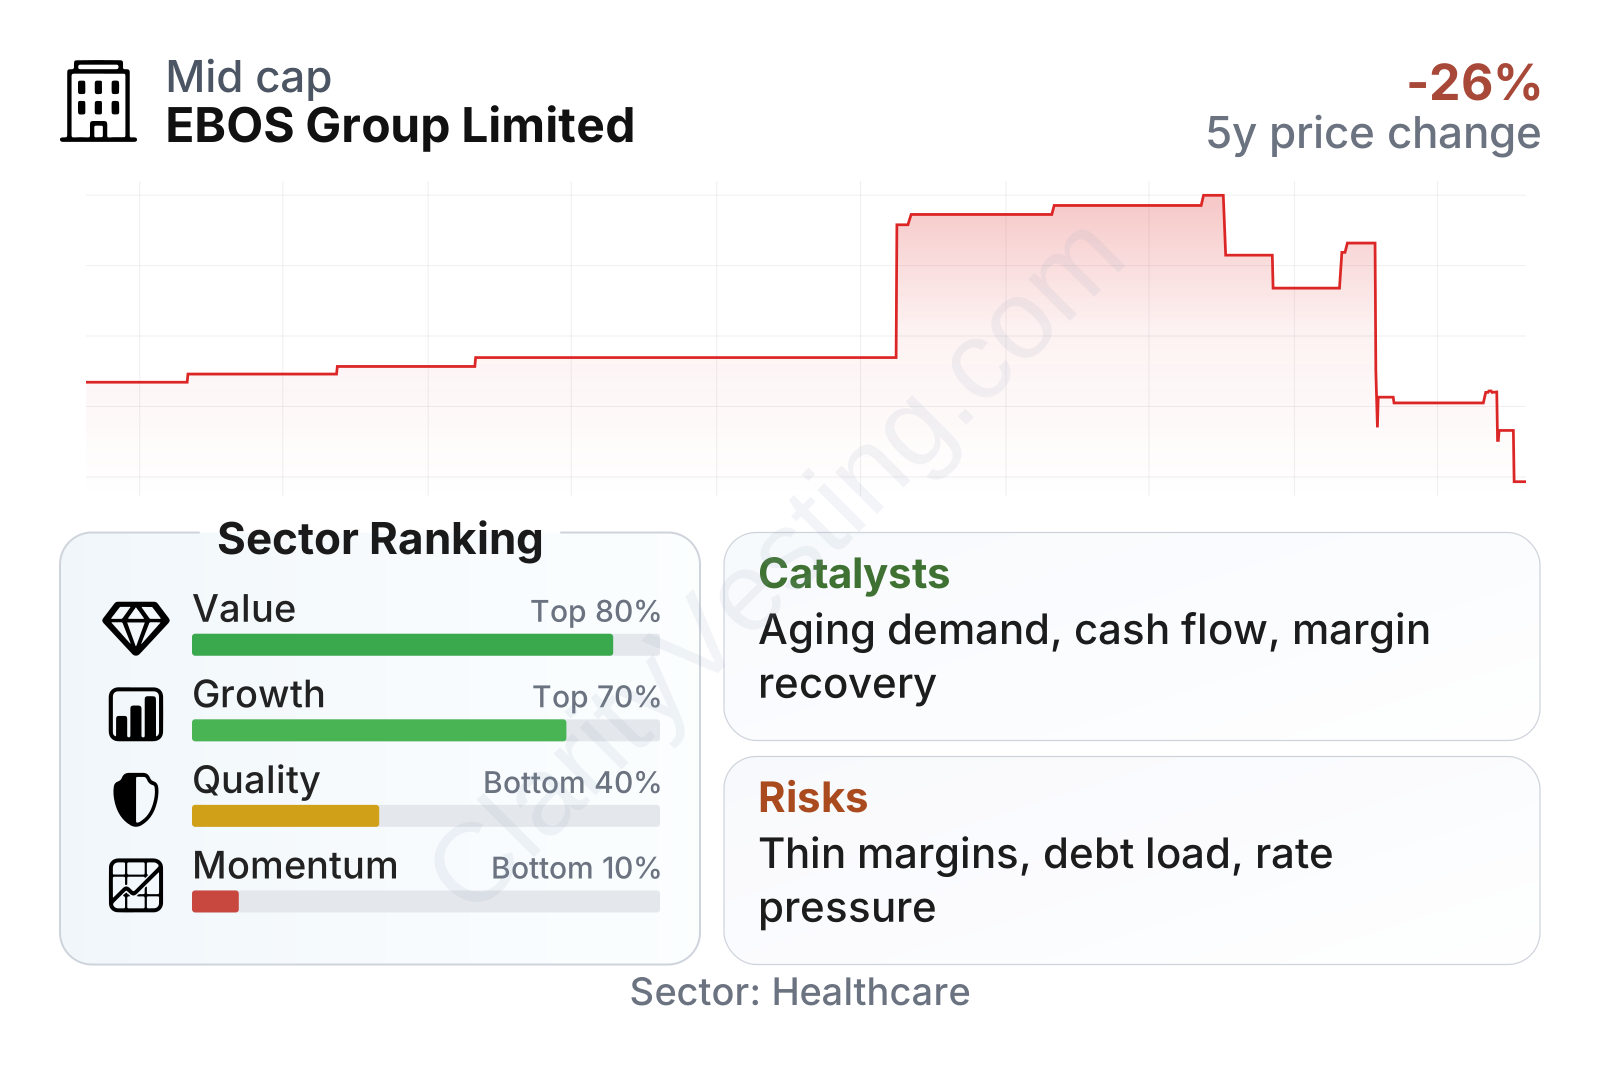
EBOS stands out as a mid-sized healthcare distributor with unusually low share-price volatility. Its beta is close to 0.15, which is far below the broader market and consistent with a defensive, essential-services business. On valuation measures, the company screens inexpensively relative to much of the healthcare sector: its earnings multiple is below the sector median, price-to-book is very low, free cash flow yield is exceptionally high, and the trailing dividend yield is well above the sector median.
At the same time, the quality profile is more mixed. Returns on assets are solid, but leverage is higher than the sector median, interest coverage is weaker, and margins are narrow. Growth metrics show modest revenue expansion and strong cash-flow progression over five years, but not much earnings-per-share growth. Price performance has also been weak over the last 6 months, 12 months, and 3 years relative to the sector, showing that the market has recently been more concerned about pressure on the business than excited by its defensive characteristics.
Growth
EBOS operates in sectors that generally benefit from durable long-term demand. Healthcare consumption tends to rise with population growth, aging populations, chronic disease treatment, and ongoing demand for medicines and medical supplies. Animal care also has favorable structural support, especially from rising pet ownership, higher spending on companion animal health, and continued demand for veterinary products.
The company’s strategy broadly makes sense for that backdrop. Distribution is a scale business: the more volume moved through the network, the harder it becomes for smaller rivals to match service levels, inventory breadth, and customer reach. EBOS has built a broad footprint across Australia and New Zealand, and its position in both healthcare and animal care gives it multiple channels for expansion. In practical terms, future growth is likely to come from a mix of organic volume gains, contract wins, service expansion, and selective acquisitions rather than a single breakthrough product.
A relevant catalyst is the company’s ability to convert revenue into cash. Even though margins are thin, free cash flow remains strong in relation to its market value. That gives EBOS more flexibility than many low-margin distributors: it can support dividends, reduce debt, invest in distribution infrastructure, and potentially pursue acquisitions if conditions are attractive.
Another point in favor of the long-term growth case is the essential nature of what the company does. Pharmacies, hospitals, and veterinary networks need dependable supply regardless of the economic cycle. That does not eliminate earnings fluctuations, but it does make the underlying demand base more resilient than in many discretionary industries.
Recent annual reporting also shows revenue returning to growth after a softer year, with sales above the prior peak. That is useful because it suggests the company has retained its commercial relevance and customer base even while profits have been under pressure. If margin execution stabilizes, even modest improvements could have a visible effect on earnings because the revenue base is so large.
Risks
This article is for informational purposes only and does not constitute financial advice. Some content is AI-generated. See Disclaimer


