Stock Analysis · Eastern Bankshares Inc (EBC)
Overview
Eastern Bankshares Inc. is the holding company for Eastern Bank, a long-established regional bank based in Massachusetts. It serves consumers, small businesses, middle-market companies, and wealth clients, with a business model centered on gathering deposits, making loans, providing cash management and advisory services, and earning fees from wealth and insurance-related activities. In simple terms, it operates like a traditional community-to-commercial bank, but at a scale large enough to compete across New England.
The company’s revenue mix is still primarily driven by banking spread income: the difference between what it earns on loans and securities and what it pays on deposits and borrowings. Based on recent annual reporting, the main sources of revenue can be summarized approximately as follows:
- Net interest income: about 75% to 85% of total revenue. This is the core banking engine and includes income from commercial loans, residential lending, home equity, consumer lending, and investment securities, net of deposit and funding costs.
- Wealth management and trust fees: about 5% to 10%. This includes fiduciary services, investment management, and related account fees.
- Insurance and employee benefits commissions: about 3% to 8%. Eastern has built fee businesses beyond lending, which helps diversify earnings.
- Deposit service charges, interchange, and other banking fees: about 3% to 7%. This covers account charges, card-related fees, treasury management, and other service revenue.
- Other noninterest income: typically a small remainder. This may include gains, loan-related charges, and miscellaneous operating income.
That mix matters for long-term analysis because a bank with some fee income is usually less exposed than a pure lender to swings in interest rates. At the same time, Eastern remains mostly a spread-income bank, so loan quality, deposit pricing, and balance-sheet discipline remain the main drivers of future results.
Over the last several years, total revenue has moved higher overall, but profitability has been more uneven. Revenue expanded from a little over $500 million in 2021 to just above $1.0 billion in 2024 and 2025, reflecting a larger balance sheet and acquisitions. However, net income has been much more volatile, showing that scale growth has not translated into smooth earnings progression.
The broad picture is one of a larger bank than it was a few years ago, with stronger revenue capacity but also higher expenses and more sensitivity to funding costs than headline revenue growth alone would suggest.
Key Figures
| Metric | Value | Sector ⓘ |
|---|---|---|
| Date | Nov 14, 2026 | |
| Context | ||
| Sector | Financial Services | |
| Industry | Banks - Regional | |
| Market Cap ⓘ | $5.16B | |
| Beta ⓘ | 0.69 | |
Value (Cheapness) | ||
| P/E Ratio ⓘ | 12.98 | 12.38 |
| P/B Ratio ⓘ | 1.18 | 1.54 |
| FCF Yield ⓘ | 8.05% | 8.62% |
| Dividend Yield ⓘ | 2.42% | 2.91% |
| EBIT / EV ⓘ | 8.10% | 8.22% |
| PEG ⓘ | N/A | |
Growth (Business expansion) | ||
| Revenue Growth ⓘ | 27.90% | 7.00% |
| RPS Growth (5Y CAGR) ⓘ | 12.61% | 12.30% |
| EPS Growth (5Y CAGR) ⓘ | 2.21% | -0.81% |
| BVPS Growth (5Y CAGR) ⓘ | 0.36% | 4.87% |
| Margin Growth (5Y Trend) ⓘ | -24.21% | -4.00% |
| FCF Growth (5Y CAGR) ⓘ | 25.07% | 4.68% |
| DPS Growth (5Y CAGR) ⓘ | 13.03% | 8.77% |
Quality (Business durability) | ||
| ROIC (Latest) ⓘ | 8.36% | 9.69% |
| ROE (Latest) ⓘ | 8.92% | 14.05% |
| ROA (Latest) ⓘ | 1.22% | 1.58% |
| ROIC (5Y Median) ⓘ | 3.55% | 7.79% |
| ROE (5Y Median) ⓘ | 4.53% | 12.05% |
| ROA (5Y Median) ⓘ | 0.78% | 1.28% |
| Net Debt / EBIT (Latest) ⓘ | 0.56 | 0.97 |
| Net Debt / EBIT (5Y Median) ⓘ | -3.68 | 0.73 |
| Net Debt / EBITDA (Latest) ⓘ | 0.58 | 0.75 |
| Operating Margin (Latest) ⓘ | 28.07% | 23.57% |
| Operating Margin (5Y Median) ⓘ | 14.55% | 24.30% |
| Debt to Equity (Latest) ⓘ | 21.52% | 59.34% |
| Profit Margin (Latest) ⓘ | 32.74% | 26.53% |
| Free Cash Flow (Latest) ⓘ | $415.50M | |
Momentum (Price trend) | ||
| 3Y Return ⓘ | +117.48% | +85.82% |
| 12M Return (excl. last month) ⓘ | +13.58% | +16.88% |
| 6M Return ⓘ | +19.39% | +8.29% |
| Price vs. 200-Day MA ⓘ | +8.85% | +5.17% |
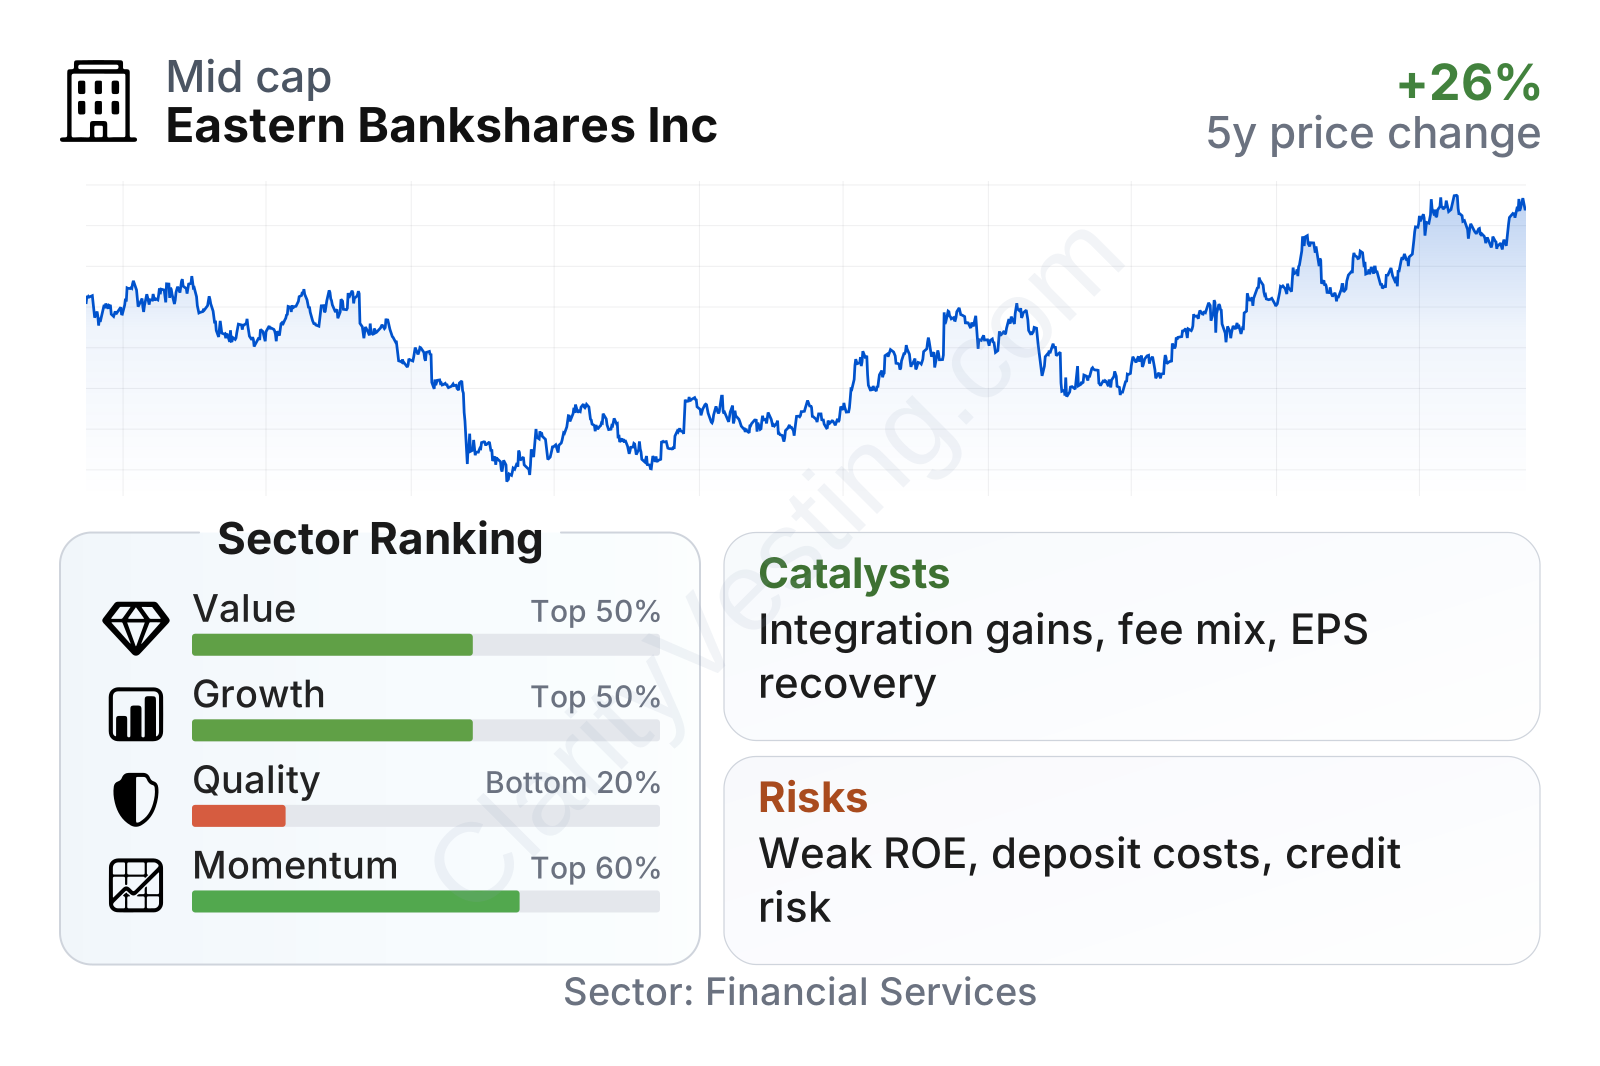
Eastern Bankshares is a mid-sized regional bank with a market value around $5 billion and a stock that has generally been less volatile than the broader market, as reflected in its beta below 1. In the factor breakdown, valuation appears close to the sector median on earnings and slightly cheaper on book value. Growth metrics look decent, especially recent revenue growth, but quality measures remain weaker than many peers because returns on equity and assets have not consistently matched the regional bank group. Momentum has been somewhat better than average, reflecting a recovery in both the share price and operating sentiment.
The share-price history also shows why this name requires patience. The stock dropped sharply during the regional banking stress of 2023, then recovered meaningfully through 2024 to 2026. That rebound suggests confidence has improved, but it also means the market is no longer pricing the company at the distressed levels seen during the banking panic.
Growth
Eastern operates in a mature industry rather than a fast-growing one. Regional banking in the Northeast is typically shaped by population stability, commercial activity, housing demand, and interest-rate cycles more than by explosive structural expansion. So the long-term case depends less on the sector itself being “high growth” and more on whether the bank can deepen relationships, gain market share, cross-sell fee services, and improve profitability on a larger asset base.
Its strategy broadly makes sense for that environment. Eastern has been building scale through acquisitions and broadening its product mix beyond plain-vanilla lending. That is important because larger regional banks can spread compliance, technology, and branch costs over more revenue, while fee businesses such as wealth and insurance can reduce reliance on net interest income alone. The challenge is execution: growth by acquisition only creates lasting value if cost saves are captured and returns improve after integration.
Earnings per share have been uneven rather than steadily compounding. After improving from 2021 to 2022, results softened in 2023 and 2024 before rebounding in 2025. Recent 2026 figures point to continuing recovery, but the pattern still looks cyclical and integration-sensitive rather than consistently linear. For long-term analysis, that means growth should be judged by normalized earning power over several years, not by a single strong period.
Book value per share has also recovered after a large drop in 2022, then moved gradually higher through 2025. For a bank, book value is an important anchor because it represents the capital base supporting future lending and earnings. The recovery is encouraging, but the five-year compounding rate has lagged the sector median, which suggests Eastern has not yet converted expansion into balance-sheet value creation as effectively as stronger peers.
A notable positive is that recent revenue growth has been much stronger than the typical regional bank. That likely reflects the benefit of a larger franchise and a better contribution from acquired operations. Another supportive factor is Eastern’s presence in relatively attractive New England markets, where affluent households, small businesses, and commercial clients can support deposit gathering, mortgage activity, treasury services, and wealth offerings.
Recent company updates in 2026 have also pointed to continued operating integration and efforts to improve efficiency, simplify systems, and extract more earnings from prior deals. If those efforts continue to show up in expense control and more stable returns, they could become one of the clearest catalysts for better long-term financial performance.
Risks
This article is for informational purposes only and does not constitute financial advice. Some content is AI-generated. See Disclaimer