Stock Analysis · Dyne Therapeutics Inc (DYN)
Overview
Dyne Therapeutics is a clinical-stage biotechnology company focused on genetic muscle diseases. Its goal is to improve how medicines reach muscle tissue, especially in disorders where current treatments have limited delivery to skeletal muscle or the heart. The company’s platform combines targeted antibodies with therapeutic cargo such as oligonucleotides to try to deliver treatment more effectively to the right tissues.
Its main development programs are aimed at myotonic dystrophy type 1, Duchenne muscular dystrophy, and facioscapulohumeral muscular dystrophy. In simple terms, Dyne is not yet a commercial drug company. It is still in the research and clinical testing phase, so the investment case depends much more on clinical progress, regulatory milestones, and future commercial potential than on present-day sales.
At this stage, Dyne’s revenue base is extremely limited. Recent annual results show no meaningful product revenue, which is typical for a pre-commercial biotechnology business. The company’s economic profile is therefore dominated by operating expenses rather than recurring sales.
- Product revenue: approximately 0%. Dyne does not currently have an approved product generating commercial sales.
- Collaboration or other revenue: no meaningful recurring contribution has recently supported the income statement.
- Financing inflows: not accounting revenue, but economically important. The business has mainly been funded through cash on hand, equity financing, and capital market access rather than customer sales.
The financial profile is straightforward: little to no revenue, heavy research spending, and a balance sheet built to finance clinical development. Over the last several years, research and development has been by far the largest use of cash, with administrative costs a distant second. That pattern fits a company trying to move multiple drug candidates through trials at the same time.
The operating structure shows a pre-revenue biotech model very clearly: expenses have climbed sharply as clinical programs advanced, and most of that increase has come from research and development rather than manufacturing or commercial infrastructure.
Key Figures
| Metric | Value | Sector ⓘ |
|---|---|---|
| Date | Nov 14, 2026 | |
| Context | ||
| Sector | Healthcare | |
| Industry | Biotechnology | |
| Market Cap ⓘ | $3.37B | |
| Beta ⓘ | 1.21 | |
Value (Cheapness) | ||
| P/E Ratio ⓘ | N/A | 25.84 |
| P/B Ratio ⓘ | 3.32 | 4.34 |
| FCF Yield ⓘ | -16.87% | 2.57% |
| Dividend Yield ⓘ | N/A | 1.62% |
| EBIT / EV ⓘ | -23.75% | 2.92% |
| PEG ⓘ | 0.19 | |
Growth (Business expansion) | ||
| Revenue Growth ⓘ | N/A | 7.15% |
| RPS Growth (5Y CAGR) ⓘ | N/A | 8.64% |
| EPS Growth (5Y CAGR) ⓘ | -3.18% | -9.67% |
| BVPS Growth (5Y CAGR) ⓘ | 1.14% | 3.71% |
| Margin Growth (5Y Trend) ⓘ | N/A | -0.63% |
| FCF Growth (5Y CAGR) ⓘ | N/A | 1.59% |
| DPS Growth (5Y CAGR) ⓘ | -13.74% | 6.69% |
Quality (Business durability) | ||
| ROIC (Latest) ⓘ | -43.41% | 5.79% |
| ROA (Latest) ⓘ | -49.96% | 2.88% |
| ROIC (5Y Median) ⓘ | -42.98% | 4.60% |
| ROA (5Y Median) ⓘ | -47.52% | 1.82% |
| Net Debt / EBIT (Latest) ⓘ | N/A | 1.33 |
| Net Debt / EBIT (5Y Median) ⓘ | N/A | 1.92 |
| Net Debt / EBITDA (Latest) ⓘ | N/A | 0.91 |
| Net Debt / Assets ⓘ | -54.17% | 5.89% |
| EBITDA / Interest ⓘ | N/A | 9.68 |
| Operating Margin (Latest) ⓘ | N/A | 9.24% |
| Operating Margin (5Y Median) ⓘ | N/A | 7.30% |
| Debt to Equity (Latest) ⓘ | 26.24% | 28.47% |
| Profit Margin (Latest) ⓘ | N/A | 3.33% |
| Free Cash Flow (Latest) ⓘ | -$568.76M | |
Momentum (Price trend) | ||
| 3Y Return ⓘ | +97.24% | +48.98% |
| 12M Return (excl. last month) ⓘ | -2.65% | +13.65% |
| 6M Return ⓘ | -6.13% | +14.05% |
| Price vs. 200-Day MA ⓘ | -11.20% | +8.64% |
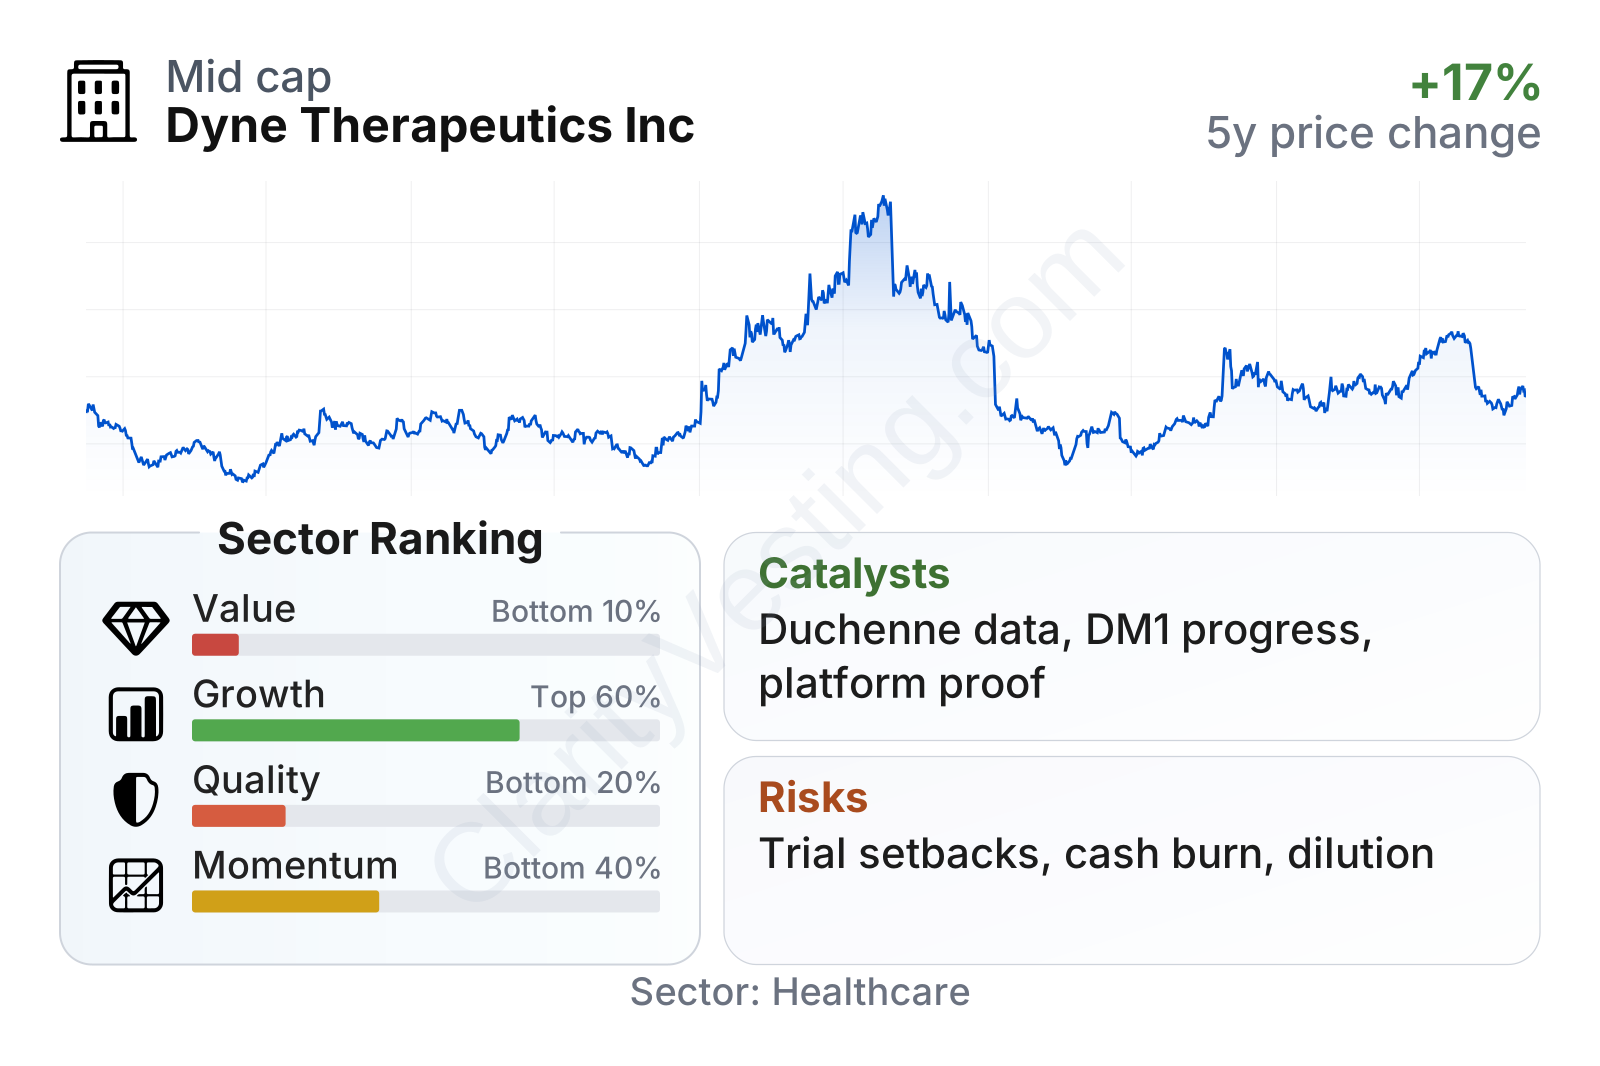
Dyne is still a mid-sized biotech by market value, with share price behavior that has been highly volatile, which is common for companies driven by trial updates. The factor table reflects that reality. Valuation metrics look weak on traditional measures because there are no profits and free cash flow remains deeply negative. Quality measures also rank low versus the broader healthcare group for the same reason: returns on capital and assets are negative while the company is still investing heavily ahead of commercialization. Growth signals are mixed rather than strong, since reported revenue is essentially absent, but loss trends and long-term equity building are more relevant than sales at this stage.
One notable point is balance sheet structure. Even with substantial cash burn, leverage has generally remained modest relative to many biotech peers, which matters because it gives the company more room to keep funding development without relying primarily on debt.
Growth
Dyne operates in a part of healthcare that remains structurally attractive for long-term growth: rare genetic diseases with high unmet medical need. These markets are often small in patient numbers but can support premium pricing if treatments show meaningful benefit. In addition, successful rare-disease drugs can build strong competitive positions because specialists, patient registries, and regulatory pathways tend to favor companies that move early and generate solid evidence.
Dyne’s strategy also makes sense on paper. Instead of approaching each disease as a completely separate problem, it is trying to use a common delivery approach across multiple muscle disorders. If that platform repeatedly shows it can get more medicine into muscle tissue, the company could create value beyond a single product candidate. That is one of the key reasons the market has paid close attention to its clinical readouts.
Reported revenue growth does not say much here because Dyne is essentially pre-commercial. The more important growth question is pipeline progression: whether its lead programs continue to generate evidence that supports later-stage trials, regulatory discussions, and eventually potential launches.
Recent company updates have kept attention on its lead pipeline programs, especially in Duchenne muscular dystrophy and myotonic dystrophy type 1. For a business like Dyne, positive clinical data can change expected future cash flows far more than near-term accounting revenue. That makes trial execution, dose expansion, and durability of response major growth catalysts.
Cash flow trends show the cost of that ambition. Free cash flow has become more negative over time as the company expanded development activity. That is not unusual for a biotech moving several assets forward, but it does mean future growth depends on turning scientific progress into milestones quickly enough to justify the rising spend.
A significant opportunity comes from the possibility that better muscle-targeted delivery could translate into stronger efficacy, broader tissue benefit, or more convenient dosing than older approaches. If clinical data continue to support that argument, Dyne could become more than a one-asset biotech and instead be viewed as a platform company with several shots on goal.
Risks
This article is for informational purposes only and does not constitute financial advice. Some content is AI-generated. See Disclaimer