Stock Analysis · Derwent London PLC (DWVYF)
Overview
Derwent London PLC is a U.K.-focused real estate company specializing in offices, with a portfolio concentrated in central London. It owns, develops, refurbishes, and manages office-led buildings, often targeting areas where creative, technology, professional services, and mixed-use occupiers want well-located space. The business model is straightforward: acquire or improve properties, lease them to tenants, collect rent, and recycle capital through selective disposals and new projects.
Its revenue base is dominated by recurring property income, while development gains and valuation movements can have a large effect on accounting profit from year to year. For long-term analysis, rental income and occupancy trends matter more than headline net income because property revaluations can swing results sharply even when the underlying buildings remain productive.
The main economic sources of revenue appear to be:
- Gross rental income and property leasing: the core source of cash generation and the largest contributor by a wide margin. In most years this represents the substantial majority of underlying revenue tied to office rents, renewals, reviews, and new lettings.
- Property management and service-related income: a smaller contribution linked to operating buildings and recovering certain tenant-related charges.
- Development and asset recycling effects: not always booked as regular revenue, but very important for long-term value creation. This includes gains from refurbishments, completed developments, and occasional disposals of mature assets.
- Other uses within the portfolio: some buildings include retail, hospitality, or mixed-use elements, but the company remains primarily an office landlord.
Geographically, the business is highly concentrated in London rather than diversified across many countries. That raises concentration risk, but it also gives Derwent London deep local expertise in planning, development, tenant demand, and asset positioning in one of Europe’s most important office markets.
Over the last several years, reported revenue has risen from roughly £241 million-equivalent levels in 2021 to about £389 million in 2025, while operating results have been much more volatile because property values and accounting adjustments moved sharply with interest rates and market sentiment. That pattern is common in listed property companies and helps explain why simple earnings multiples can be misleading for this sector.
The overall flow shows a business with solid gross profitability from rent, but one whose reported profit can swing widely when operating expenses, financing costs, and property-related adjustments change. The rebound in 2024 and stronger revenue in 2025 suggest the underlying portfolio remained active even after the difficult valuation period of 2022 and 2023.
Key Figures
| Metric | Value | Sector ⓘ |
|---|---|---|
| Date | Oct 03, 2026 | |
| Context | ||
| Sector | Real Estate | |
| Industry | REIT - Office | |
| Market Cap ⓘ | $2.58B | |
| Beta ⓘ | 1.19 | |
Value (Cheapness) | ||
| P/E Ratio ⓘ | 41.18 | 17.35 |
| P/B Ratio ⓘ | 1.01 | 0.86 |
| FCF Yield ⓘ | 6.00% | 7.47% |
| Dividend Yield ⓘ | 3.38% | 4.75% |
| EBIT / EV ⓘ | N/A | 3.81% |
| PEG ⓘ | 26.08 | |
Growth (Business expansion) | ||
| Revenue Growth ⓘ | 3.80% | 5.30% |
| RPS Growth (5Y CAGR) ⓘ | 4.62% | 5.96% |
| EPS Growth (5Y CAGR) ⓘ | -3.48% | -11.41% |
| BVPS Growth (5Y CAGR) ⓘ | -11.81% | 0.41% |
| Margin Growth (5Y Trend) ⓘ | -60.39% | 0.53% |
| FCF Growth (5Y CAGR) ⓘ | N/A | 5.40% |
| DPS Growth (5Y CAGR) ⓘ | -5.41% | 5.02% |
Quality (Business durability) | ||
| ROIC (Latest) ⓘ | 4.92% | 5.77% |
| ROE (Latest) ⓘ | 8.11% | 7.64% |
| ROA (Latest) ⓘ | 5.50% | 2.85% |
| ROIC (5Y Median) ⓘ | 4.18% | 4.20% |
| ROE (5Y Median) ⓘ | 3.29% | 6.03% |
| ROA (5Y Median) ⓘ | 2.26% | 2.45% |
| Net Debt / EBIT (Latest) ⓘ | 5.49 | 7.57 |
| Net Debt / EBIT (5Y Median) ⓘ | N/A | 8.41 |
| Net Debt / EBITDA (Latest) ⓘ | 5.45 | 5.12 |
| Net Debt / Assets ⓘ | 26.53% | 37.84% |
| EBITDA / Interest ⓘ | 2.26 | 4.11 |
| Operating Margin (Latest) ⓘ | 37.17% | 35.40% |
| Operating Margin (5Y Median) ⓘ | 54.54% | 36.59% |
| Debt to Equity (Latest) ⓘ | 41.50% | 89.06% |
| Profit Margin (Latest) ⓘ | 11.65% | 19.99% |
| Free Cash Flow (Latest) ⓘ | $154.55M | |
Momentum (Price trend) | ||
| 3Y Return ⓘ | +10.90% | +30.60% |
| 12M Return (excl. last month) ⓘ | +29.17% | +7.55% |
| 6M Return ⓘ | +15.70% | +0.69% |
| Price vs. 200-Day MA ⓘ | -6.03% | -2.30% |
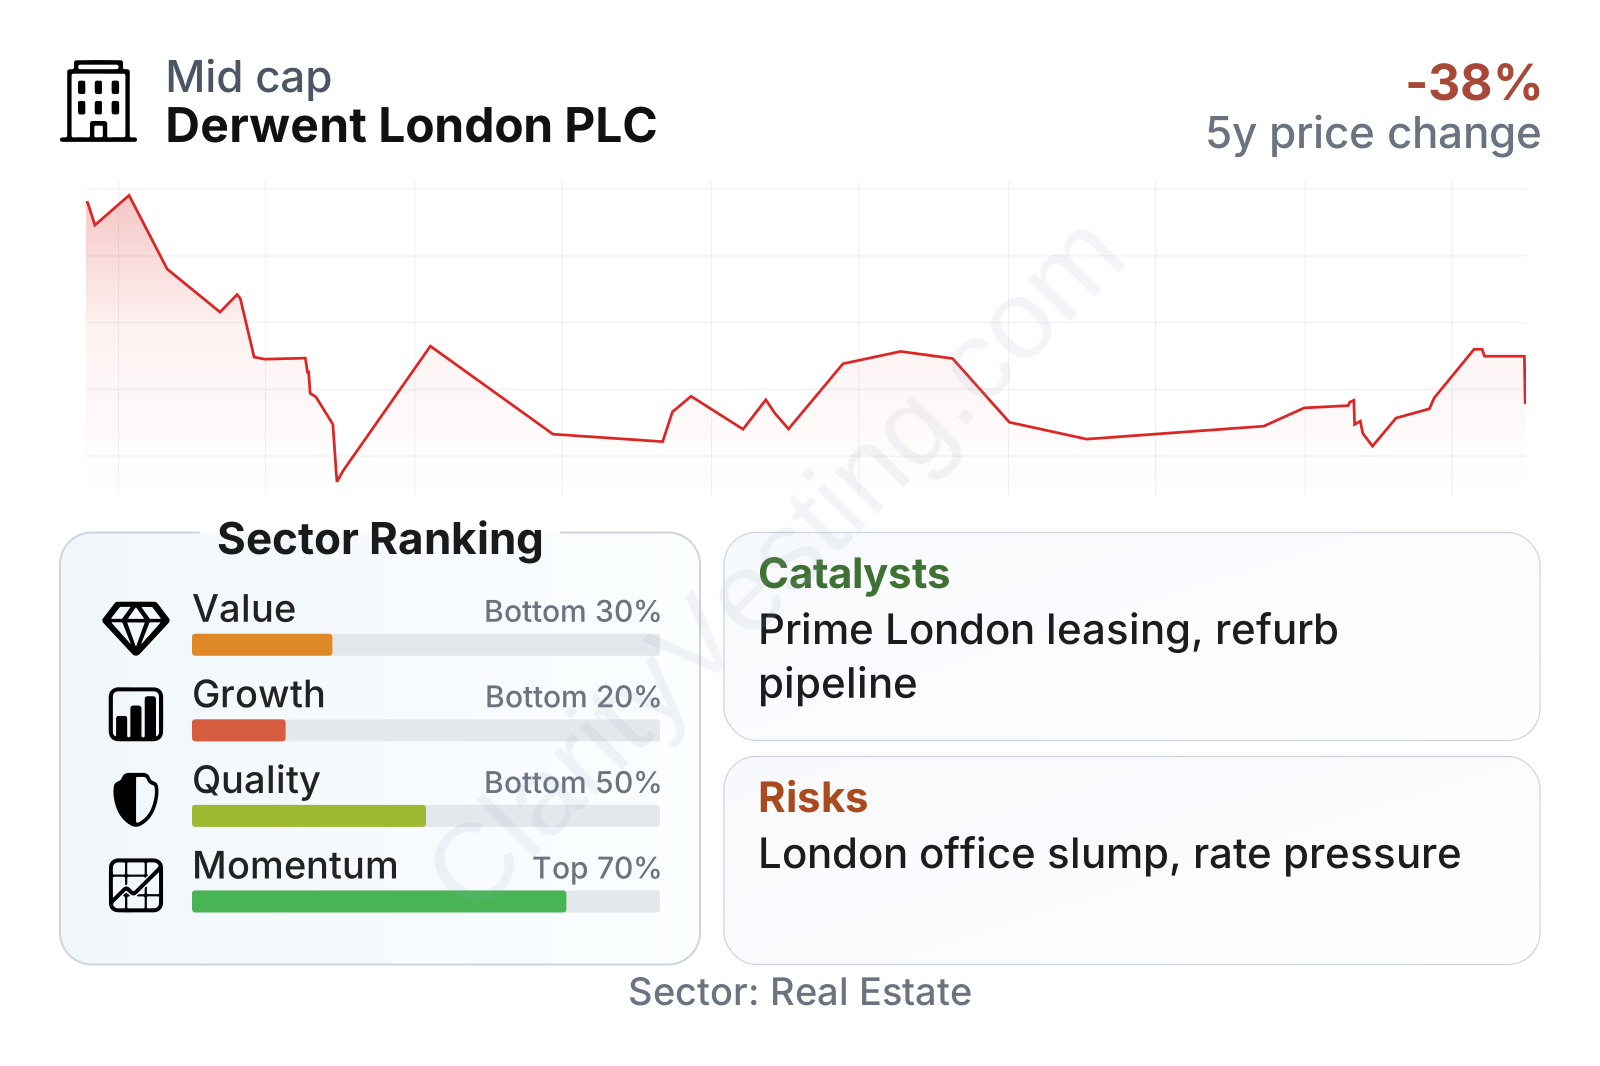
Derwent London sits in the mid-cap range and shows a mixed profile. On valuation, it screens weaker than much of the sector, with a high earnings multiple and a price-to-book ratio slightly above its own real estate peer median in the latest snapshot, although the separate historical price-to-book chart shows the shares trading below the broader sector median more recently. Quality is also mixed: leverage against assets and equity looks relatively controlled for a property company, but interest coverage is on the low side, which matters in a higher-rate world. Growth metrics are the weakest area, especially book value and dividend progression over five years, while recent share-price momentum has been better than much of the sector over the last 6 to 12 months.
For a real estate company like Derwent London, two details deserve extra attention. First, debt to equity around 41% and net debt to assets around 27% indicate balance-sheet leverage that is meaningful but not extreme for the industry. Second, free cash flow remains positive, which supports operational resilience even though accounting earnings and asset values can move around considerably.
Growth
Derwent London operates in a sector that is going through a split rather than a simple expansion. The broad office market has been under pressure since remote and hybrid work changed demand patterns, and higher interest rates hurt property values across the industry. But prime, well-located, modern office space in major cities has held up much better than lower-quality stock. That is the key point for Derwent London: its strategy is not based on owning generic office space, but on curating central London buildings that can still attract tenants seeking quality, location, sustainability, and flexible layouts.
This gives the company a plausible long-term growth path even in a difficult market. Older office supply in London faces rising obsolescence risk, especially where buildings fail modern environmental standards or no longer fit occupier needs. A landlord that can refurbish and reposition assets may benefit from that scarcity. In practice, Derwent London’s development-led model aims to create higher rents and stronger demand by upgrading assets instead of relying only on broad market rent inflation.
Revenue per share has moved upward steadily over the last five years, rising at roughly a mid-single-digit annual pace. That matters because it suggests the underlying portfolio is still generating more income per share despite a difficult office backdrop. It points to leasing traction, development completions, or both.
The dividend trend is less smooth. Payments increased gradually through 2024 and then dropped in 2025, which signals that distribution growth has not matched the steadier rise in revenue per share. For a long-term view, that gap suggests management may be prioritizing balance-sheet flexibility and capital allocation over a mechanically rising payout.
A meaningful catalyst is the repricing opportunity in London offices. If capital markets stabilize and occupiers continue favoring premium buildings, companies with development pipelines and refurbishable stock could see better leasing spreads and firmer asset values. Derwent London is also positioned to benefit if stricter sustainability standards push tenants away from outdated offices toward upgraded space. In that sense, regulation can become a demand driver for the right landlord rather than only a compliance cost.
Recent operating progress also matters more than macro headlines. The company’s recent revenue improvement and return to positive net income after the valuation-driven downturn show that the portfolio has not structurally broken. The core question is whether that recovery continues through rents, occupancy, and development delivery rather than through temporary market relief.
Risks
This article is for informational purposes only and does not constitute financial advice. Some content is AI-generated. See Disclaimer


