Stock Analysis · Devon Energy Corporation (DVN)
Overview
Devon Energy is a U.S. oil and gas exploration and production company. In simple terms, it drills wells, produces crude oil, natural gas, and natural gas liquids, and then sells those commodities into the market. The company focuses on large onshore shale basins in the United States, with activity centered in areas such as the Delaware Basin, Eagle Ford, Anadarko Basin, Williston Basin, and Powder River Basin. Its business is straightforward, but its results are highly influenced by commodity prices, drilling productivity, and capital discipline.
Revenue mainly comes from selling the hydrocarbons it produces. Based on recent company reporting, crude oil remains the largest contributor because it typically carries the highest realized pricing, while gas and natural gas liquids add important volume and cash flow support. Approximate revenue mix can shift materially from quarter to quarter with prices, but a reasonable recent breakdown is:
- Oil: about 65% to 75% of revenue. This is the company’s most important product and usually the main driver of profitability.
- Natural gas liquids: about 15% to 20% of revenue. This includes products such as propane, butane, and ethane.
- Natural gas: about 10% to 15% of revenue. This is more price-sensitive and has generally lower margins than oil.
Devon is not a refiner, pipeline giant, or integrated energy major. It is primarily an upstream producer, which means performance depends heavily on how efficiently it can replace reserves, control costs, and generate cash across the commodity cycle.
The financial flow over the last several years shows a business that can produce strong operating profits in favorable markets, but with earnings and cash generation moving up and down as prices soften or costs rise. Revenue recovered after the 2023 decline, yet profits have not returned to the 2022 peak, highlighting the cyclical nature of the company’s economics.
Key Figures
| Metric | Value | Sector ⓘ |
|---|---|---|
| Date | Oct 24, 2026 | |
| Context | ||
| Sector | Energy | |
| Industry | Oil & Gas E&P | |
| Market Cap ⓘ | $55.42B | |
| Beta ⓘ | 0.54 | |
Value (Cheapness) | ||
| P/E Ratio ⓘ | 10.98 | 15.40 |
| P/B Ratio ⓘ | 1.12 | 1.71 |
| FCF Yield ⓘ | 3.02% | 8.24% |
| Dividend Yield ⓘ | 2.04% | 3.52% |
| EBIT / EV ⓘ | 7.15% | 7.45% |
| PEG ⓘ | 2.92 | |
Growth (Business expansion) | ||
| Revenue Growth ⓘ | 64.20% | 26.85% |
| RPS Growth (5Y CAGR) ⓘ | 10.46% | 6.78% |
| EPS Growth (5Y CAGR) ⓘ | -26.58% | -14.41% |
| BVPS Growth (5Y CAGR) ⓘ | 15.38% | 6.08% |
| Margin Growth (5Y Trend) ⓘ | -3.86% | 0.55% |
| FCF Growth (5Y CAGR) ⓘ | -0.83% | 2.75% |
| DPS Growth (5Y CAGR) ⓘ | -16.01% | 16.79% |
Quality (Business durability) | ||
| ROIC (Latest) ⓘ | 11.86% | 11.30% |
| ROA (Latest) ⓘ | 6.42% | 6.00% |
| ROIC (5Y Median) ⓘ | 22.80% | 10.35% |
| ROA (5Y Median) ⓘ | 15.54% | 5.46% |
| Net Debt / EBIT (Latest) ⓘ | 2.26 | 1.64 |
| Net Debt / EBIT (5Y Median) ⓘ | 1.36 | 1.82 |
| Net Debt / EBITDA (Latest) ⓘ | 1.22 | 1.08 |
| Net Debt / Assets ⓘ | 15.14% | 17.29% |
| EBITDA / Interest ⓘ | 17.28 | 9.53 |
| Operating Margin (Latest) ⓘ | 24.11% | 16.21% |
| Operating Margin (5Y Median) ⓘ | 26.92% | 20.55% |
| Debt to Equity (Latest) ⓘ | 28.13% | 52.27% |
| Profit Margin (Latest) ⓘ | 17.46% | 8.79% |
| Free Cash Flow (Latest) ⓘ | $1.67B | |
Momentum (Price trend) | ||
| 3Y Return ⓘ | +13.87% | +68.93% |
| 12M Return (excl. last month) ⓘ | +43.71% | +42.90% |
| 6M Return ⓘ | +10.86% | +9.18% |
| Price vs. 200-Day MA ⓘ | +10.90% | +9.87% |
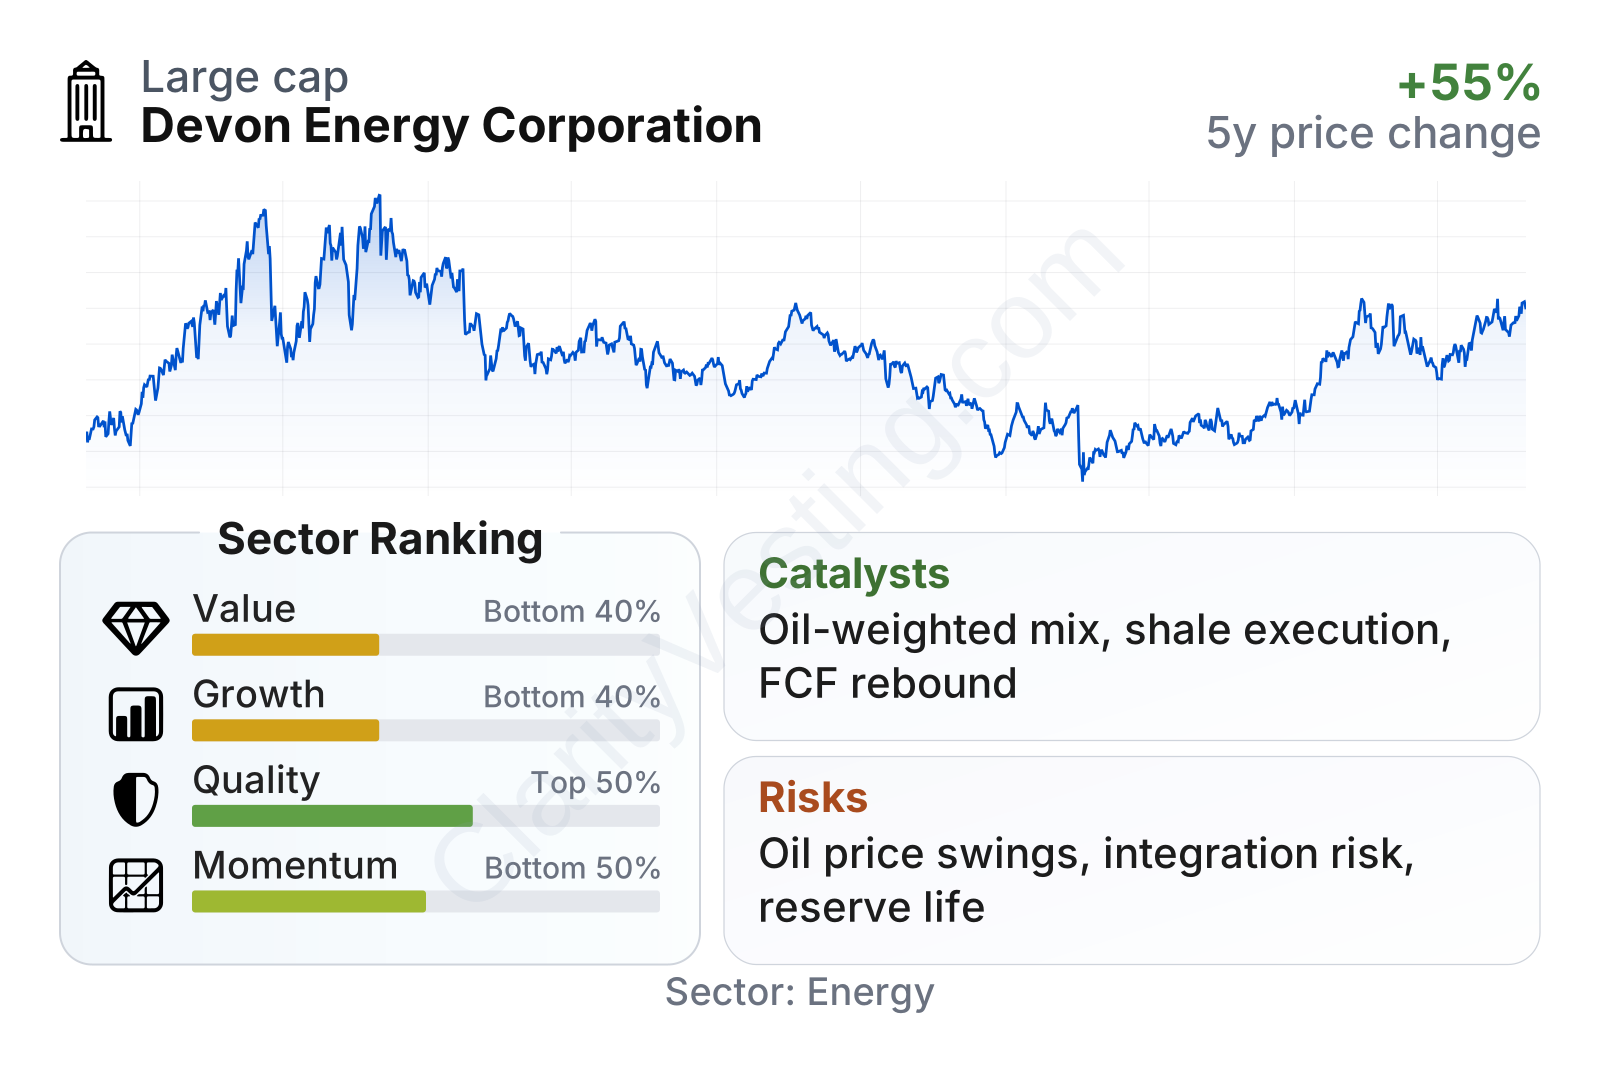
Devon is a large independent U.S. producer with a market value above $50 billion, so it has meaningful scale without being as diversified as the oil supermajors. The table points to a mixed profile. On valuation multiples such as earnings and book value, the shares trade below sector medians, but cash flow-based value is less obviously discounted. Quality metrics are generally solid: returns on capital and assets are slightly above sector norms, profit margins remain comfortably above industry medians, and interest coverage is strong. Growth is less convincing on a multi-year basis because earnings, free cash flow, and dividend growth have been uneven despite a recent rebound in revenue. Price performance has also lagged much of the energy group over the last three years, which helps explain why headline valuation ratios look modest.
Growth
Long-term sector growth for oil and gas producers is more complicated than in industries driven by steady demand expansion. Global energy demand continues to require large volumes of oil and gas, especially for transportation, industrial use, petrochemicals, and power reliability. That supports the sector’s relevance. At the same time, this is not a structurally fast-growth industry in the usual sense. Production gains often depend on drilling intensity, acquisitions, and commodity pricing rather than a constantly expanding customer base.
Devon’s strategy is built around concentrating capital in high-return U.S. shale assets, improving operating efficiency, and using scale to lower costs. That approach is sensible for this industry. Shale offers shorter development cycles than large offshore or international projects, which gives management flexibility to adjust spending if oil or gas prices weaken. The company has also used acquisitions to deepen its inventory and operating footprint, aiming to keep production durable without relying only on organic exploration.
Recent revenue trends show how quickly Devon’s business can turn. After a difficult stretch in 2023 and parts of 2024, year-over-year revenue growth improved sharply in the latest reading. That suggests stronger production, stronger commodity realizations, or both. Still, the pattern remains volatile, which is normal for upstream energy companies and means one strong quarter does not automatically establish a stable growth runway.
Free cash flow is one of the most important indicators for a company like Devon because it shows whether production is translating into money left after capital spending. The recent pattern is uneven: strong cash generation earlier in the cycle, a drop into negative territory at one point, and then a recovery back above $2.5 billion. That rebound matters because Devon’s model depends on converting operating strength into cash that can support debt management, dividends, and reinvestment.
One of the clearer catalysts is continued execution in its core basins after the company’s portfolio reshaping and acquisitions. If Devon can keep well productivity high and maintain disciplined spending, production growth can become more valuable even in a flatter oil-price environment. Another important catalyst is any period of sustained strength in oil prices, since the company’s revenue mix is heavily tilted toward oil. In addition, if management continues to simplify the portfolio or improve capital efficiency, the market may place more weight on Devon’s margin strength and scale.
Risks
This article is for informational purposes only and does not constitute financial advice. Some content is AI-generated. See Disclaimer


