Stock Analysis · Distribution Solutions Group Inc (DSGR)
Overview
Distribution Solutions Group Inc. is a specialized industrial distributor. In simple terms, it helps maintenance teams, manufacturers, utilities, food processors, HVAC contractors, and other business customers get the parts, consumables, and technical items they need to keep operations running. Rather than selling one narrow product line, the company offers a very broad catalog of maintenance, repair, operating, and original-equipment products through several business platforms.
Its business model is built around recurring industrial demand. Customers regularly need items such as fasteners, safety supplies, fluid power components, welding products, bearings, power transmission parts, electrical products, seals, adhesives, tools, and other maintenance supplies. That can make revenue more repeatable than in one-time capital equipment businesses, although still tied to the health of industrial activity.
Based on the company’s recent filings, revenue is mainly generated through three operating segments.
- Lawson Products: roughly 33% to 35% of revenue. This segment focuses on maintenance and repair supplies, including fasteners, cutting tools, chemicals, safety items, and shop products sold to industrial, commercial, and institutional customers.
- Gexpro Services: roughly 30% to 32% of revenue. This business provides supply-chain and vendor-managed inventory solutions, especially for original equipment manufacturers in areas such as transportation equipment, industrial technology, and other manufacturing end markets.
- TestEquity: roughly 33% to 36% of revenue. This segment serves engineers, laboratories, and technical customers with test and measurement equipment, electronic production supplies, tool kits, and related services.
This mix matters because it gives the company exposure to several end markets rather than relying on one niche. It also reflects the company’s broader strategy: combining distribution businesses that can cross-sell, improve purchasing scale, and use a shared operating platform.
The financial flow over the last several years shows a company that has expanded revenue rapidly, mostly through acquisitions, while keeping gross profit dollars moving higher. The weak point has been the distance between gross profit and net income, where interest expense and operating costs have absorbed much of the benefit from scale.
Key Figures
| Metric | Value | Sector ⓘ |
|---|---|---|
| Date | Oct 17, 2026 | |
| Context | ||
| Sector | Industrials | |
| Industry | Industrial Distribution | |
| Market Cap ⓘ | $1.62B | |
| Beta ⓘ | 0.53 | |
Value (Cheapness) | ||
| P/E Ratio ⓘ | 184.58 | 22.10 |
| P/B Ratio ⓘ | 2.49 | 1.97 |
| FCF Yield ⓘ | 1.54% | 6.38% |
| Dividend Yield ⓘ | N/A | 1.94% |
| EBIT / EV ⓘ | 2.89% | 4.79% |
| PEG ⓘ | 2.69 | |
Growth (Business expansion) | ||
| Revenue Growth ⓘ | 11.00% | 9.30% |
| RPS Growth (5Y CAGR) ⓘ | 13.40% | 7.81% |
| EPS Growth (5Y CAGR) ⓘ | -18.09% | -13.06% |
| BVPS Growth (5Y CAGR) ⓘ | 14.22% | 6.14% |
| Margin Growth (5Y Trend) ⓘ | 1.47% | 0.88% |
| FCF Growth (5Y CAGR) ⓘ | N/A | 11.01% |
| DPS Growth (5Y CAGR) ⓘ | N/A | 9.48% |
Quality (Business durability) | ||
| ROIC (Latest) ⓘ | 3.29% | 10.84% |
| ROA (Latest) ⓘ | 0.50% | 5.41% |
| ROIC (5Y Median) ⓘ | 3.81% | 9.38% |
| ROA (5Y Median) ⓘ | -0.45% | 4.95% |
| Net Debt / EBIT (Latest) ⓘ | 11.12 | 2.08 |
| Net Debt / EBIT (5Y Median) ⓘ | 12.01 | 2.27 |
| Net Debt / EBITDA (Latest) ⓘ | 5.15 | 1.39 |
| Net Debt / Assets ⓘ | 42.37% | 19.28% |
| EBITDA / Interest ⓘ | 2.87 | 9.58 |
| Operating Margin (Latest) ⓘ | 3.37% | 10.50% |
| Operating Margin (5Y Median) ⓘ | 3.23% | 10.29% |
| Debt to Equity (Latest) ⓘ | 129.14% | 65.48% |
| Profit Margin (Latest) ⓘ | 0.44% | 6.67% |
| Free Cash Flow (Latest) ⓘ | $25.00M | |
Momentum (Price trend) | ||
| 3Y Return ⓘ | +10.67% | +61.68% |
| 12M Return (excl. last month) ⓘ | +11.90% | +12.58% |
| 6M Return ⓘ | +28.96% | 0.00% |
| Price vs. 200-Day MA ⓘ | +17.17% | +0.02% |
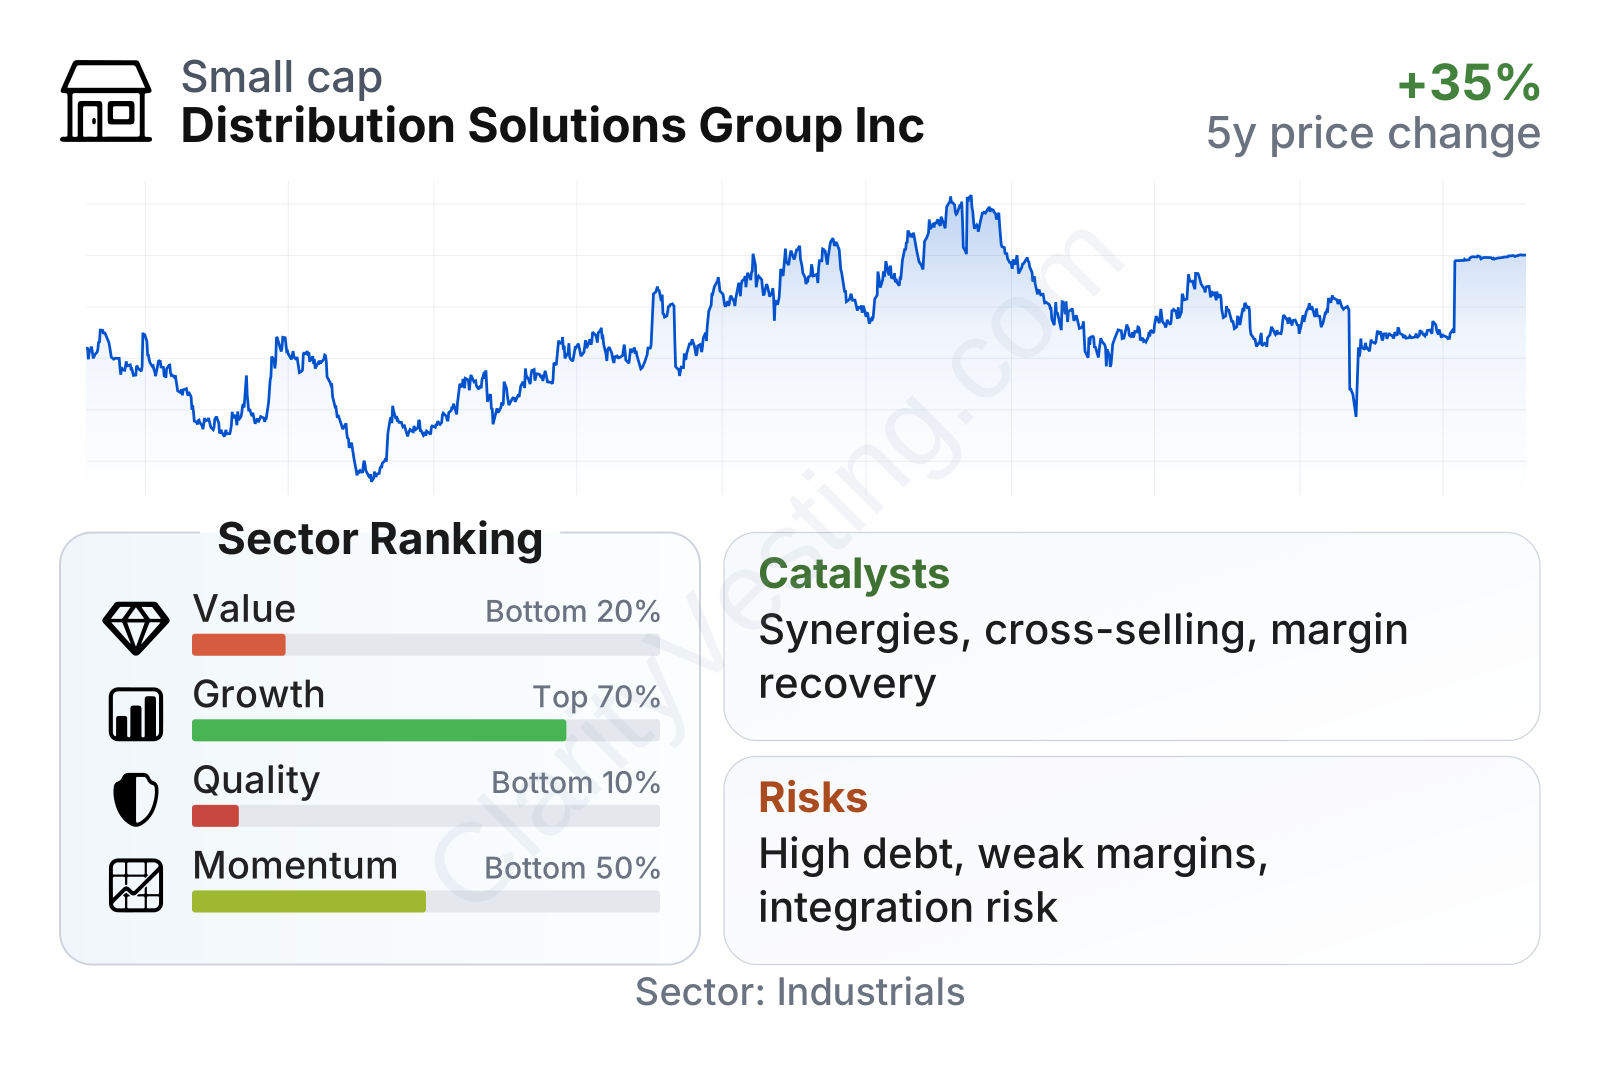
Distribution Solutions Group is a small-to-mid-sized industrial distributor by market value, and its share price has been less volatile than the broader market, as shown by a beta well below 1. In the factor breakdown, growth looks better than the company’s overall profile, with revenue expansion running modestly above the sector median and five-year revenue-per-share growth clearly ahead of many peers. The weaker side is business quality: returns on capital and assets are low, leverage is high, and margins remain thin. On valuation, the stock screens as expensive on earnings and free-cash-flow yield versus the sector, which suggests the market is looking past current profitability and focusing more on future integration gains and scale.
Growth
Industrial distribution is not usually a glamorous sector, but it can be a durable one. Businesses still need a steady flow of parts, consumables, and technical supplies regardless of whether the economy is booming or simply operating normally. Over time, this market tends to benefit from outsourcing, more complex supply chains, and customer demand for fewer vendors that can provide broader catalogs and inventory management. Those trends support the logic behind Distribution Solutions Group’s model.
The company’s strategy also makes sense on paper. It has been building a larger multi-brand platform through acquisitions and operational integration. The combination of Lawson Products, Gexpro Services, and TestEquity gives it a wider set of customer relationships, broader purchasing scale, and more opportunities to cross-sell. If management executes well, that can improve margins over time even if underlying industry growth remains moderate.
Revenue growth has been strong over the multi-year period, although it is important to separate acquisition-driven expansion from organic growth. The biggest jumps came during the period when the business mix changed materially through transactions, and more recent growth has normalized into a more moderate range. Even so, the latest year-over-year pace remains slightly above the sector median, which suggests the company is still expanding faster than many industrial peers.
Cash generation is another important point. Free cash flow was negative earlier in the expansion phase, then turned positive and has remained positive more recently, though not at a particularly large level relative to the company’s size. That is encouraging because it shows the business can generate cash after working capital and capital spending, but it is not yet strong enough to erase concerns about debt or low net profitability.
A meaningful catalyst is the possibility of margin improvement from integration and scale. Distribution businesses can become more efficient when they consolidate suppliers, improve logistics, raise private-label mix, and spread fixed costs across a larger revenue base. Another potential opportunity is exposure to OEM supply-chain programs and technical electronics demand through Gexpro Services and TestEquity, which give the group access to markets beyond basic maintenance products.
Recent company communications have continued to emphasize integration, cross-selling, and operational improvement rather than a dramatic shift in business direction. That is significant because for this company, the most important opportunity is not discovering a new market; it is proving that a larger combined platform can convert its revenue base into clearly better earnings and cash flow.
Risks
This article is for informational purposes only and does not constitute financial advice. Some content is AI-generated. See Disclaimer


