Stock Analysis · Drax Group PLC (DRXGY)
Overview
Drax Group PLC is a British power generation and energy services company focused on renewable and lower-carbon electricity. It is best known for operating a large biomass-fueled power station in the UK, supplying electricity to businesses through its retail arm, and developing carbon-removal projects tied to bioenergy with carbon capture and storage, often called BECCS. In simple terms, Drax earns money from producing power, selling that power and related services, and positioning itself for future income from carbon capture and removals.
The business is usually discussed in three main operating areas. Based on recent annual reporting, revenue is weighted most heavily toward customer supply and energy-related services, while profits can be more influenced by generation and contracted renewable assets because commodity price swings can distort revenue mix from one year to the next.
- Customers / Energy supply: approximately 55% to 70% of group revenue in recent years. This includes supplying electricity and related services to business customers, mainly in the UK.
- Generation: approximately 20% to 35% of group revenue. This includes biomass generation, pumped storage, hydro assets, and power sales connected to Drax’s generation fleet.
- Pellet production and other operations: approximately 10% to 15% of group revenue. This includes the production and sale of sustainable wood pellets used as biomass fuel, plus some intra-group and external sales.
That revenue split should be treated as approximate because energy prices, hedging, and inter-segment activity can make one year look very different from another. What matters more for a long-term view is that Drax combines physical infrastructure, fuel sourcing, power generation, and customer supply in one platform. That makes it more diversified than a pure power plant operator, but also more complex to assess.
Over the last several years, revenue rose sharply during the energy price shock and then cooled as commodity markets normalized. Even so, gross profit and operating income remained far above 2021 levels through 2024, showing that the company captured stronger economics during a volatile period. The more recent drop in net income compared with operating profit suggests that taxes, accounting items, and market conditions can make bottom-line results much less steady than underlying operations.
The income profile shows a business with large input costs and cyclical swings in reported earnings. Revenue has come down from its 2023 peak, but cost of revenue also fell materially, which helped preserve a solid operating base. That is important for a utility-like company trying to fund major future projects.
Key Figures
| Metric | Value | Sector ⓘ |
|---|---|---|
| Date | Oct 17, 2026 | |
| Context | ||
| Sector | Utilities | |
| Industry | Utilities - Renewable | |
| Market Cap ⓘ | $3.42B | |
| Beta ⓘ | 0.66 | |
Value (Cheapness) | ||
| P/E Ratio ⓘ | 88.29 | 17.28 |
| P/B Ratio ⓘ | 2.01 | 1.51 |
| FCF Yield ⓘ | 23.69% | 0.65% |
| Dividend Yield ⓘ | 4.01% | 3.77% |
| EBIT / EV ⓘ | N/A | 5.01% |
| PEG ⓘ | N/A | |
Growth (Business expansion) | ||
| Revenue Growth ⓘ | -6.30% | 6.10% |
| RPS Growth (5Y CAGR) ⓘ | 229.26% | 3.87% |
| EPS Growth (5Y CAGR) ⓘ | 37.36% | -11.30% |
| BVPS Growth (5Y CAGR) ⓘ | 251.07% | 4.23% |
| Margin Growth (5Y Trend) ⓘ | 6.13% | 3.57% |
| FCF Growth (5Y CAGR) ⓘ | 51.96% | -8.84% |
| DPS Growth (5Y CAGR) ⓘ | 250.39% | 4.84% |
Quality (Business durability) | ||
| ROIC (Latest) ⓘ | N/A | 6.53% |
| ROA (Latest) ⓘ | 8.43% | 3.20% |
| ROIC (5Y Median) ⓘ | 6.29% | 5.95% |
| ROA (5Y Median) ⓘ | 1.59% | 2.75% |
| Net Debt / EBIT (Latest) ⓘ | 0.82 | 7.13 |
| Net Debt / EBIT (5Y Median) ⓘ | 3.80 | 7.23 |
| Net Debt / EBITDA (Latest) ⓘ | 0.59 | 4.31 |
| Net Debt / Assets ⓘ | 21.37% | 38.42% |
| EBITDA / Interest ⓘ | N/A | 4.58 |
| Operating Margin (Latest) ⓘ | 11.39% | 20.83% |
| Operating Margin (5Y Median) ⓘ | 9.89% | 20.08% |
| Debt to Equity (Latest) ⓘ | 68.79% | 137.69% |
| Profit Margin (Latest) ⓘ | 0.36% | 11.37% |
| Free Cash Flow (Latest) ⓘ | $810.09M | |
Momentum (Price trend) | ||
| 3Y Return ⓘ | +127.08% | +52.37% |
| 12M Return (excl. last month) ⓘ | +7.05% | +8.84% |
| 6M Return ⓘ | -6.90% | -3.95% |
| Price vs. 200-Day MA ⓘ | -6.25% | -0.79% |
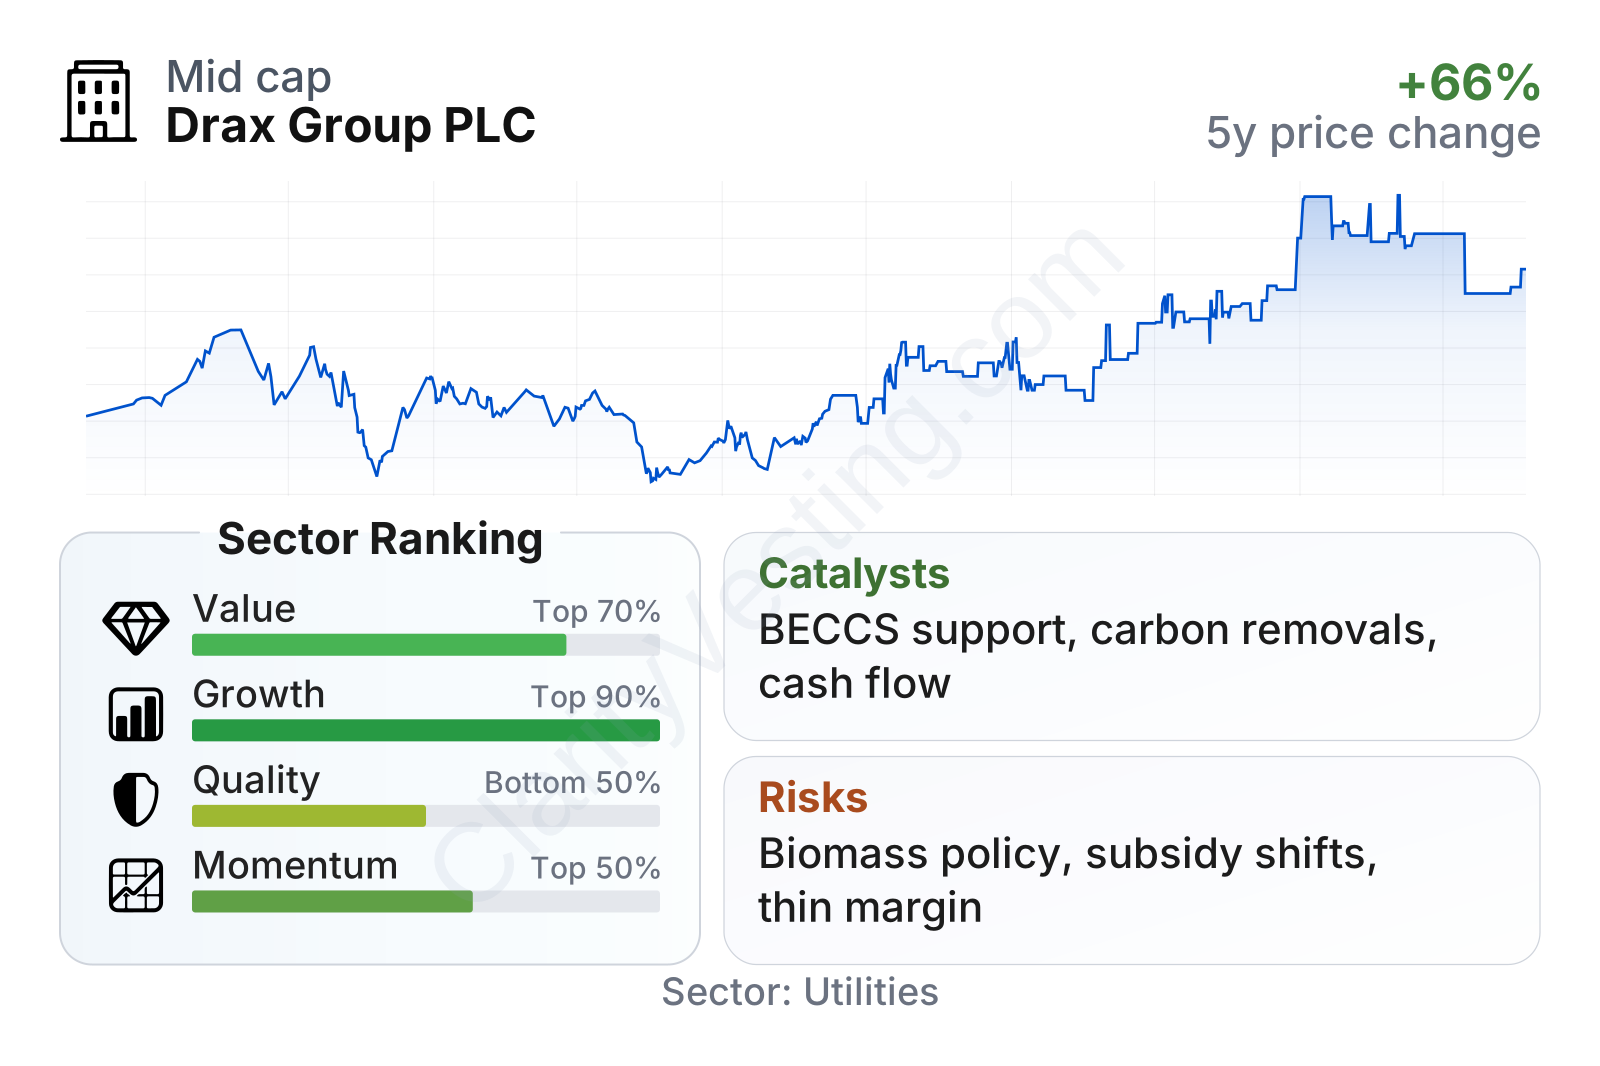
Drax is a mid-sized utility and renewable power company with a relatively low beta of about 0.62, meaning its share price has historically moved less than the broader market. The share price trend has been strong over three years, but shorter-term momentum has weakened, with the stock sitting below its long-term average after a softer recent period.
Valuation metrics look mixed. The headline P/E ratio is very high, but that appears to reflect unusually low recent earnings rather than a classic high-growth valuation. By contrast, free cash flow yield is exceptionally strong and stands far above the sector median, which suggests the market is looking past cash generation and focusing more on earnings volatility, policy risk, and execution risk. The dividend yield is also slightly above the sector median.
On quality, the picture is uneven. Debt metrics look healthier than many utility peers, with net debt to EBITDA and debt to equity both materially below sector norms. However, margins and profit margin are weaker than the sector median, which helps explain why the company ranks better on balance-sheet strength than on overall business quality.
Growth
Drax operates in a part of the utility market linked to several long-term themes: energy security, renewable generation, dispatchable low-carbon power, and carbon removal. Those themes are likely to remain relevant for many years because wind and solar growth increases the need for flexible generation and system balancing, while decarbonization targets increase interest in technologies that can remove carbon dioxide from the atmosphere rather than simply reduce emissions.
The company’s strategy is built around using biomass generation as a bridge toward carbon-negative power through BECCS. If that model scales, Drax could move from being mainly an electricity producer to also being a provider of carbon removals. That matters because carbon removals may become a distinct and valuable market, especially in countries trying to meet net-zero goals while managing hard-to-abate emissions.
Its current asset base also supports the growth case. Drax already owns and operates generation infrastructure, biomass supply capabilities, and trading relationships. That gives it a practical starting point that many early-stage carbon removal companies do not have. In other words, the future plan is attached to an operating business rather than a concept alone.
Longer-term growth measures are unusually strong relative to the utility sector, especially over five years. Revenue per share, earnings per share, book value per share, free cash flow, and dividends have all expanded much faster than the sector median over that period. The latest year-over-year revenue decline does not necessarily break that trend; it mostly reflects normalization after unusually strong energy-market conditions.
A significant catalyst remains the UK government framework for supporting biomass generation with carbon capture. Drax has spent years advancing the case for BECCS at its power station, and policy clarity on support mechanisms, permitting, and carbon accounting would be a major step toward unlocking the project. The company has also highlighted carbon removals as a potentially important long-term earnings stream, which could broaden how the market values the business.
Another positive development is that Drax continues to generate substantial cash, giving it more flexibility to invest in operations, maintain shareholder distributions, and prepare for large capital projects. In a sector where growth often depends on balance-sheet capacity, cash generation is a real strategic asset.
Risks
This article is for informational purposes only and does not constitute financial advice. Some content is AI-generated. See Disclaimer


