Stock Analysis · Alpha Tau Medical Ltd (DRTS)
Overview
Alpha Tau Medical Ltd is a medical technology company developing a cancer treatment platform called Alpha DaRT, short for Diffusing Alpha-emitters Radiation Therapy. The idea is relatively simple: tiny sources containing radium are placed directly into a solid tumor, where they release short-range alpha radiation intended to destroy cancer cells from inside the tumor while limiting exposure to surrounding healthy tissue. The company is still in the clinical and pre-commercial stage, so the business is centered more on research, trials, regulatory work, and physician adoption efforts than on established product sales.
At this stage, Alpha Tau does not appear to have meaningful recurring commercial revenue. Recent annual results indicate revenue of essentially 0%, which means the company is still operating mainly as a development-stage biotechnology and medical device business rather than a mature healthcare supplier.
The economic profile is therefore unusual compared with traditional healthcare companies. Current cash use is driven mainly by product development, clinical studies, and corporate infrastructure rather than by manufacturing at scale or broad hospital sales.
- Product revenue: approximately 0%. Commercial sales have not yet become a meaningful contributor.
- Collaboration, licensing, or other operating revenue: no significant contribution disclosed in recent annual figures.
- Financing-related inflows: not revenue in accounting terms, but historically the company has depended primarily on cash raised from investors to fund operations.
One clear pattern in the operating structure is that research and development is the dominant expense line. Over the last several years, R&D spending has generally represented roughly 70% to 80% of total operating expenses, showing that most resources are still being directed toward clinical progress and platform expansion rather than current commercialization.
The financial flow highlights a business with virtually no revenue so far, persistent operating losses, and a spending mix heavily weighted toward R&D. That is typical for an early-stage oncology company, but it also means the investment case depends largely on future clinical and regulatory progress rather than present-day earnings power.
Key Figures
| Metric | Value | Sector ⓘ |
|---|---|---|
| Date | Oct 17, 2026 | |
| Context | ||
| Sector | Healthcare | |
| Industry | Biotechnology | |
| Market Cap ⓘ | $1.22B | |
| Beta ⓘ | 1.22 | |
Value (Cheapness) | ||
| P/E Ratio ⓘ | N/A | 24.79 |
| P/B Ratio ⓘ | 27.17 | 3.08 |
| FCF Yield ⓘ | -3.19% | 3.15% |
| Dividend Yield ⓘ | N/A | 1.94% |
| EBIT / EV ⓘ | -7.02% | 0.57% |
| PEG ⓘ | N/A | |
Growth (Business expansion) | ||
| Revenue Growth ⓘ | N/A | 7.45% |
| RPS Growth (5Y CAGR) ⓘ | N/A | 8.61% |
| EPS Growth (5Y CAGR) ⓘ | N/A | -17.81% |
| BVPS Growth (5Y CAGR) ⓘ | N/A | 3.72% |
| Margin Growth (5Y Trend) ⓘ | N/A | -0.62% |
| FCF Growth (5Y CAGR) ⓘ | N/A | 1.04% |
| DPS Growth (5Y CAGR) ⓘ | N/A | 6.77% |
Quality (Business durability) | ||
| ROIC (Latest) ⓘ | -98.03% | 3.24% |
| ROA (Latest) ⓘ | -77.49% | 3.01% |
| ROIC (5Y Median) ⓘ | -37.24% | 4.60% |
| ROA (5Y Median) ⓘ | -41.59% | 1.89% |
| Net Debt / EBIT (Latest) ⓘ | N/A | 1.34 |
| Net Debt / EBIT (5Y Median) ⓘ | N/A | 1.84 |
| Net Debt / EBITDA (Latest) ⓘ | N/A | 1.00 |
| Net Debt / Assets ⓘ | -5.84% | 5.45% |
| EBITDA / Interest ⓘ | N/A | 9.64 |
| Operating Margin (Latest) ⓘ | N/A | 9.27% |
| Operating Margin (5Y Median) ⓘ | N/A | 7.38% |
| Debt to Equity (Latest) ⓘ | 34.39% | 28.58% |
| Profit Margin (Latest) ⓘ | N/A | 3.59% |
| Free Cash Flow (Latest) ⓘ | -$38.95M | |
Momentum (Price trend) | ||
| 3Y Return ⓘ | +246.32% | +42.80% |
| 12M Return (excl. last month) ⓘ | +286.23% | +18.50% |
| 6M Return ⓘ | +67.01% | +7.57% |
| Price vs. 200-Day MA ⓘ | +28.88% | +5.12% |
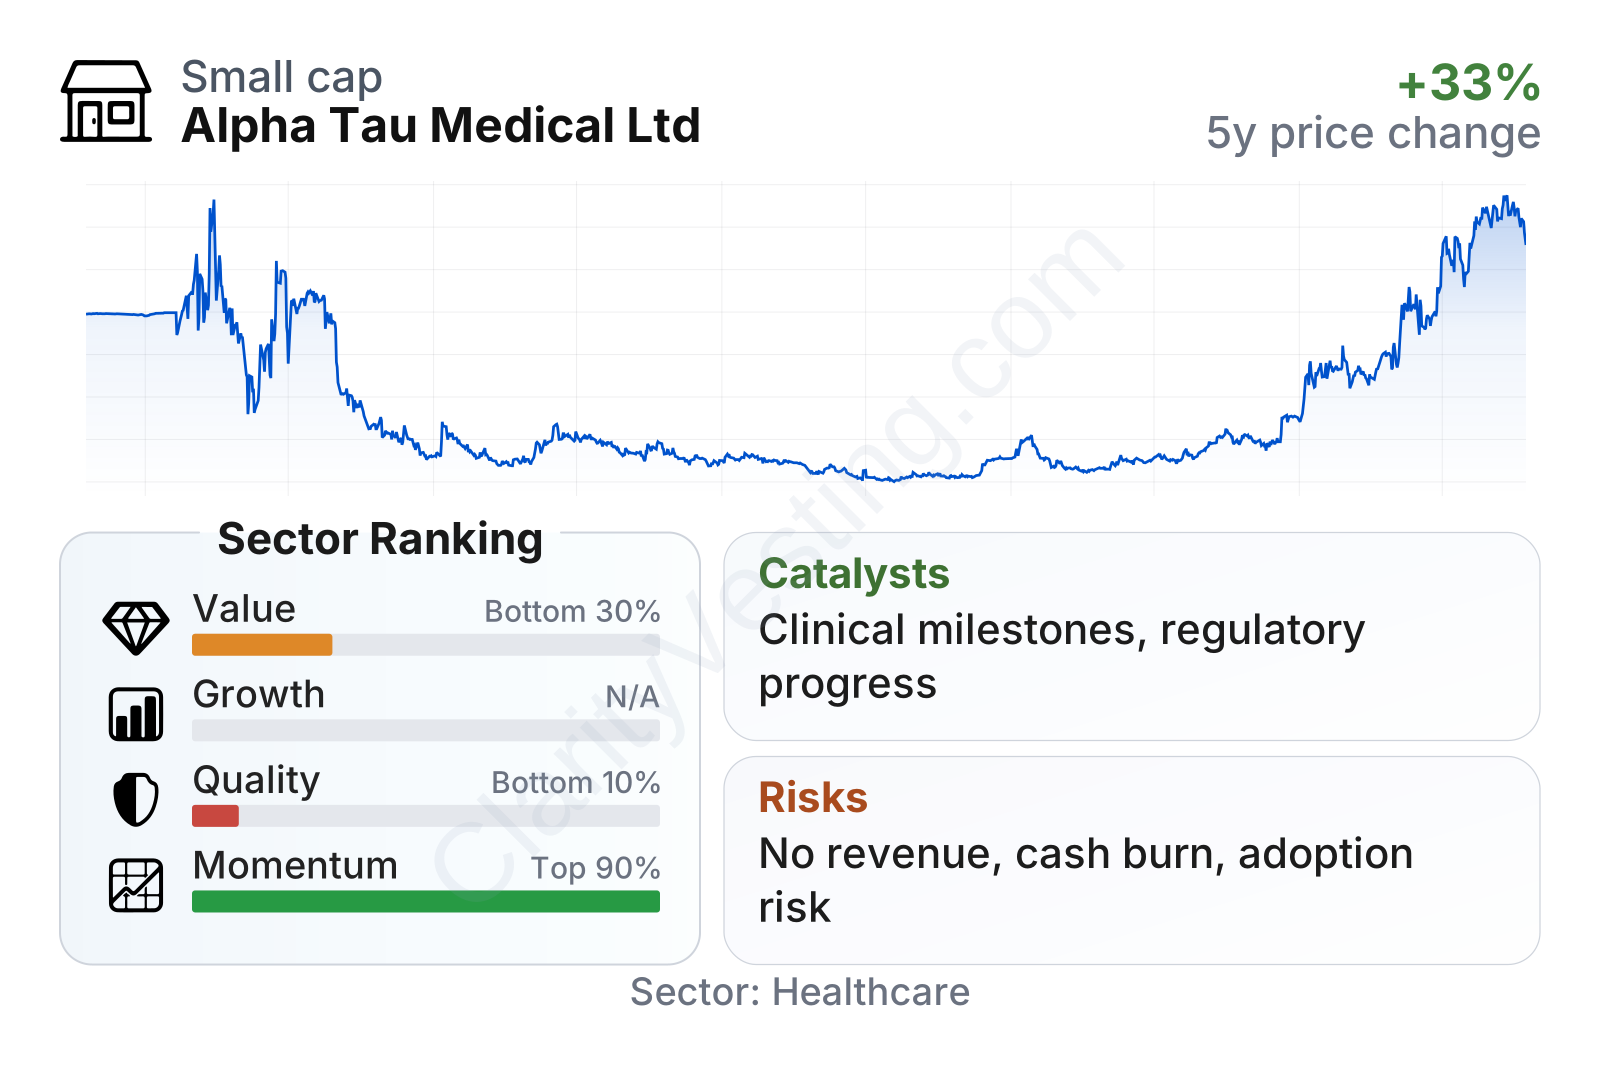
Alpha Tau is a mid-sized public company by biotech standards, but its fundamentals still look like those of a pre-revenue development business. On valuation, it ranks in the weaker part of the healthcare sector, with a very high price-to-book multiple and negative cash flow yield, which reflects a market value built mostly on future expectations rather than current financial output.
On quality metrics, the company sits near the bottom of the sector because profitability and returns on capital remain deeply negative. That is not surprising for a company with no meaningful revenue, but it does underline that the present balance between spending and business output is still highly unfavorable.
The standout area is momentum. The share price has risen sharply over the last 6 months, 12 months, and 3 years relative to the sector, suggesting that market sentiment has improved significantly. In practice, that means the stock has been responding more to changes in expectations around clinical progress and commercial potential than to operating results.
Growth
Alpha Tau operates in a part of healthcare that has genuine long-term growth potential. Cancer treatment remains one of the largest and most active areas in medicine, and there is strong ongoing demand for therapies that can improve local tumor control while reducing side effects. Radiation oncology is already a major treatment category, so a platform that can be used across multiple solid tumors has a large theoretical opportunity if clinical outcomes continue to support the concept.
The company’s strategy is coherent for that goal. Rather than pursuing a single narrow indication, Alpha Tau has been working to validate Alpha DaRT across several tumor types and clinical settings. That broader platform approach can be attractive because success in one indication may help support interest in others, especially if the treatment procedure is practical for physicians and can fit into existing cancer care pathways.
Another potential growth driver is regulation. The key inflection point for a company like this is not gradual quarterly revenue growth, but milestone events such as trial results, regulatory clearances, treatment-center expansion, and early evidence of physician adoption. Public company communications in 2026 have continued to emphasize clinical advancement and expansion of the treatment footprint, which is the type of progress the market tends to watch most closely in businesses at this stage.
Cash generation remains negative, which is expected for a company still funding trials and development. The important point is not near-term free cash flow improvement, but whether current cash burn is translating into clinical validation and a clearer path toward commercialization. If that conversion begins to show up through approvals and treatment demand, the growth profile could change quickly because revenue is starting from a very low base.
A notable recent signal is the sharp improvement in market momentum during 2026. That does not prove commercial success, but it often indicates that investors are assigning a higher probability to meaningful future milestones. For a company with little current revenue, shifts in expected clinical and regulatory outcomes can have an outsized effect on valuation.
Risks
This article is for informational purposes only and does not constitute financial advice. Some content is AI-generated. See Disclaimer


