Stock Analysis · Domino's Pizza Enterprises Limited (DPZUF)
Overview
Domino’s Pizza Enterprises Limited is the largest master franchisee of the Domino’s brand outside the United States. The group operates and franchises pizza stores across several markets in the Asia-Pacific and Europe regions, with especially important positions in Australia, New Zealand, Japan, France, Germany, and nearby European countries. Its business is not the same as Domino’s Pizza, Inc. in the U.S.; instead, Domino’s Pizza Enterprises holds the rights to develop and run the Domino’s network in its territories under franchise arrangements.
The company makes money from a mix of retail store sales, franchise-related income, and supply chain activities. In practice, the biggest revenue stream comes from sales generated in stores the company operates directly, followed by food, ingredients, and other supplies sold into the network, with royalties, franchise fees, and related income making up a smaller share. Based on the group’s reported business model and historical disclosures, the revenue mix is best understood as follows:
- Corporate store sales: roughly 55% to 70% of revenue in recent years. This includes pizza, sides, drinks, and other menu sales from company-operated stores.
- Supply chain and commissary sales: roughly 25% to 40% of revenue. This covers dough, ingredients, packaging, and distribution services supplied to franchisees and company stores.
- Royalties, franchise fees, and other franchise-related income: generally 5% to 10% of revenue. This includes ongoing royalties, store opening fees, and related service income.
The attraction of this model is that a large store network can create scale in purchasing, logistics, and marketing. That said, recent years show that revenue has not translated smoothly into profit, as costs, restructuring, and weaker performance in some markets have put pressure on earnings.
The company’s revenue base has been relatively resilient over several years, staying around the low-to-mid billions of dollars, but profitability has been far more volatile. Gross profit and operating income have narrowed meaningfully from earlier peaks, which suggests that cost inflation, weaker store economics, and business restructuring have had a larger effect than sales alone would imply.
Key Figures
| Metric | Value | Sector ⓘ |
|---|---|---|
| Date | Nov 21, 2026 | |
| Context | ||
| Sector | Consumer Cyclical | |
| Industry | Restaurants | |
| Market Cap ⓘ | $1.58B | |
| Beta ⓘ | 1.07 | |
Value (Cheapness) | ||
| P/E Ratio ⓘ | 30.67 | 17.13 |
| P/B Ratio ⓘ | N/A | 2.72 |
| FCF Yield ⓘ | 15.00% | 7.52% |
| Dividend Yield ⓘ | 3.45% | 2.43% |
| EBIT / EV ⓘ | 7.50% | 7.11% |
| PEG ⓘ | 2.58 | |
Growth (Business expansion) | ||
| Revenue Growth ⓘ | -17.10% | 5.30% |
| RPS Growth (5Y CAGR) ⓘ | -4.91% | 8.77% |
| EPS Growth (5Y CAGR) ⓘ | 7.84% | -11.05% |
| BVPS Growth (5Y CAGR) ⓘ | -0.20% | 5.47% |
| Margin Growth (5Y Trend) ⓘ | -5.61% | -0.16% |
| FCF Growth (5Y CAGR) ⓘ | -20.65% | 5.66% |
| DPS Growth (5Y CAGR) ⓘ | -30.09% | 9.76% |
Quality (Business durability) | ||
| ROIC (Latest) ⓘ | N/A | 11.36% |
| ROA (Latest) ⓘ | -5.86% | 5.53% |
| ROIC (5Y Median) ⓘ | 6.32% | 10.58% |
| ROA (5Y Median) ⓘ | 1.53% | 5.35% |
| Net Debt / EBIT (Latest) ⓘ | 3.97 | 2.11 |
| Net Debt / EBIT (5Y Median) ⓘ | 11.11 | 2.24 |
| Net Debt / EBITDA (Latest) ⓘ | 1.74 | 1.51 |
| Net Debt / Assets ⓘ | 48.60% | 21.74% |
| EBITDA / Interest ⓘ | 9.07 | 9.63 |
| Operating Margin (Latest) ⓘ | 5.74% | 9.20% |
| Operating Margin (5Y Median) ⓘ | 5.49% | 9.64% |
| Debt to Equity (Latest) ⓘ | 245.30% | 74.26% |
| Profit Margin (Latest) ⓘ | -6.56% | 5.47% |
| Free Cash Flow (Latest) ⓘ | $236.62M | |
Momentum (Price trend) | ||
| 3Y Return ⓘ | -49.67% | +15.79% |
| 12M Return (excl. last month) ⓘ | +61.32% | -0.63% |
| 6M Return ⓘ | +48.66% | +1.17% |
| Price vs. 200-Day MA ⓘ | +27.03% | +0.36% |
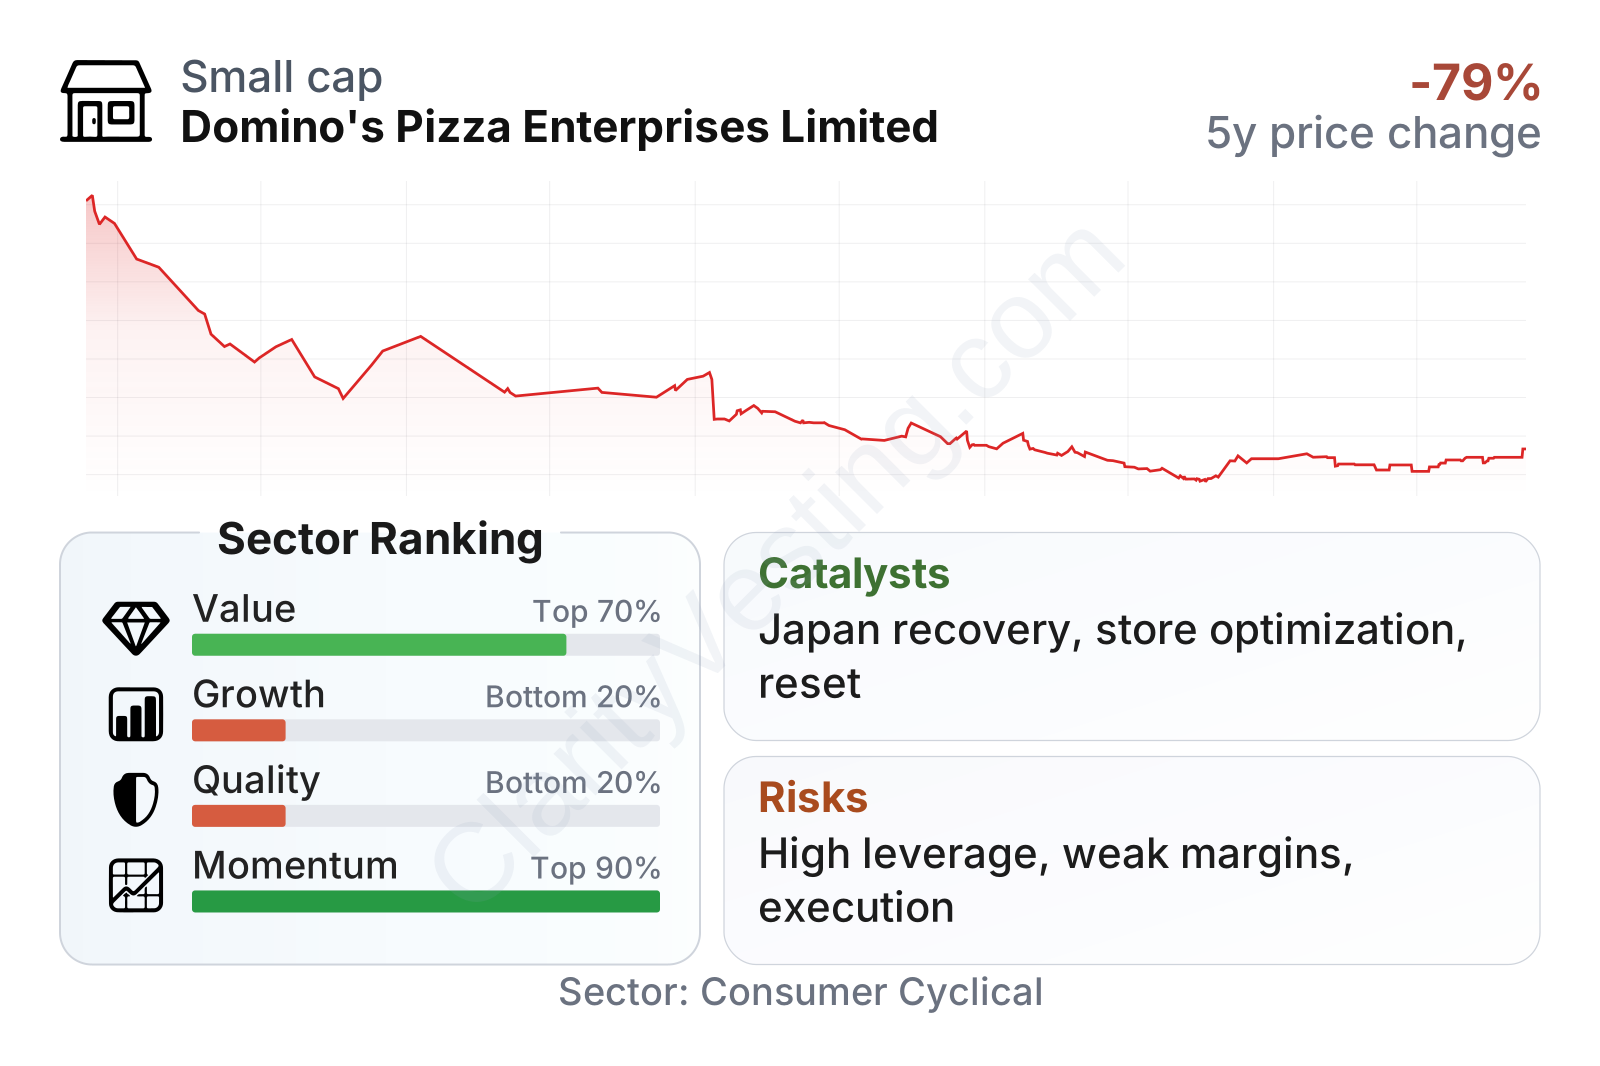
Domino’s Pizza Enterprises is a mid-sized listed restaurant operator with market value around the low single-digit billions of dollars and share price volatility close to the broader market. The current factor profile is mixed. On value measures, the company screens better than many restaurant peers because free cash flow yield, dividend yield, and operating earnings relative to enterprise value are above sector medians. However, that does not automatically mean the business is cheap in a broad sense, because earnings quality and growth metrics are weaker.
Growth ranks in the lower part of the sector, with recent revenue declining year over year and five-year trends in revenue per share, free cash flow, and dividends all under pressure. Quality measures are also soft: leverage is elevated, returns on assets are negative on a trailing basis, and operating margins remain below the industry median. Market performance has also been difficult over the long run, even though shorter-term price moves have shown some stabilization compared with the earlier sharp decline.
Growth
The company operates in a segment with favorable long-term demand drivers. Pizza delivery and takeout remain supported by convenience, digital ordering, and the ability to serve value-focused consumers. Domino’s as a brand is especially well suited to this environment because the model is built around quick service, delivery logistics, app-based ordering, and repeat purchasing rather than occasional high-ticket dining.
Domino’s Pizza Enterprises also has a strategy that is logical on paper for future growth. It can expand through new store openings, improve same-store sales, lift franchise economics, and use scale in supply chain and technology across multiple countries. In stronger periods, this model can produce a powerful combination of network growth and recurring royalty income. The company has also previously emphasized operational simplification, market-by-market discipline, and franchisee support, all of which matter when restoring store-level profitability.
The near-term issue is that the recent growth picture has been weak rather than strong. Sales have contracted on a year-over-year basis, and the longer record shows that top-line expansion has stalled compared with the broader restaurant sector. So while the industry backdrop is still attractive, the company’s own execution needs to improve before that sector growth clearly converts into better financial results.
A meaningful catalyst is any recovery in major markets where margins and store productivity have slipped. Japan is particularly important because it has been one of the group’s largest businesses and a key source of earlier expansion. A better balance between pricing, promotional activity, labor costs, and store economics could materially improve profitability. Another catalyst is network optimization: closing weaker stores and concentrating capital on more productive locations can initially reduce revenue but improve returns over time if done well.
Recent company communications have also centered on leadership transition and operational reset. That can create a genuine opportunity if management succeeds in simplifying the estate, rebuilding franchisee health, and restoring more consistent earnings conversion. For a franchised food business, even a modest improvement in unit economics can have a noticeable effect on group profit.
Risks
This article is for informational purposes only and does not constitute financial advice. Some content is AI-generated. See Disclaimer