Stock Analysis · DPC Holdings PLC (DPC)
Overview
DPC Holdings PLC operates in the aerospace and defense industry. Based on public company information, the business is focused on supplying products and services tied to aircraft and defense-related systems, where performance, certification, and long customer relationships matter. This is typically an industry with high technical requirements, long sales cycles, and significant dependence on government budgets, commercial aviation demand, and execution quality.
The available public information here does not provide a precise 2026 revenue split by business line or end market that can be stated reliably with percentages. What can be said is that revenue appears to come mainly from aerospace and defense activities, likely including a mix of products, programs, and support work tied to those markets. For a long-term reader, the important point is less the exact product list and more the company’s position in an industry where scale, certifications, customer trust, and contract visibility can create durable revenue streams when operations are working well.
Recent financial flow trends show a company that is still expanding its top line, with revenue moving higher year over year, but not yet translating that growth into healthy bottom-line results. Gross profit improved between 2024 and 2025, which suggests pricing, mix, or volume may be helping. However, high overhead and especially heavy interest expense continued to push net income deeply negative.
The financial flow also points to a key issue: revenue growth alone has not been enough to offset financing costs and operating expenses. That means the long-term case depends heavily on whether management can convert rising sales into stronger margins and cash generation.
Key Figures
| Metric | Value | Sector ⓘ |
|---|---|---|
| Date | Oct 24, 2026 | |
| Context | ||
| Sector | Industrials | |
| Industry | Aerospace & Defense | |
| Market Cap ⓘ | $4.35B | |
| Beta ⓘ | N/A | |
Value (Cheapness) | ||
| P/E Ratio ⓘ | N/A | 22.29 |
| P/B Ratio ⓘ | 4.17 | 1.98 |
| FCF Yield ⓘ | -1.00% | 6.26% |
| Dividend Yield ⓘ | N/A | 1.92% |
| EBIT / EV ⓘ | -1.96% | 4.83% |
| PEG ⓘ | N/A | |
Growth (Business expansion) | ||
| Revenue Growth ⓘ | 33.70% | 9.30% |
| RPS Growth (5Y CAGR) ⓘ | N/A | 7.76% |
| EPS Growth (5Y CAGR) ⓘ | N/A | -13.17% |
| BVPS Growth (5Y CAGR) ⓘ | N/A | 6.13% |
| Margin Growth (5Y Trend) ⓘ | N/A | 0.74% |
| FCF Growth (5Y CAGR) ⓘ | N/A | 10.79% |
| DPS Growth (5Y CAGR) ⓘ | N/A | 9.41% |
Quality (Business durability) | ||
| ROIC (Latest) ⓘ | N/A | 10.75% |
| ROA (Latest) ⓘ | N/A | 5.41% |
| ROIC (5Y Median) ⓘ | N/A | 9.37% |
| ROA (5Y Median) ⓘ | N/A | 4.95% |
| Net Debt / EBIT (Latest) ⓘ | N/A | 2.04 |
| Net Debt / EBIT (5Y Median) ⓘ | N/A | 2.27 |
| Net Debt / EBITDA (Latest) ⓘ | N/A | 1.39 |
| Net Debt / Assets ⓘ | -13.61% | 19.27% |
| EBITDA / Interest ⓘ | N/A | 9.58 |
| Operating Margin (Latest) ⓘ | -8.96% | 10.49% |
| Operating Margin (5Y Median) ⓘ | N/A | 10.30% |
| Debt to Equity (Latest) ⓘ | 76.32% | 64.82% |
| Profit Margin (Latest) ⓘ | -26.12% | 6.67% |
| Free Cash Flow (Latest) ⓘ | -$43.30M | |
Momentum (Price trend) | ||
| 3Y Return ⓘ | N/A | +67.77% |
| 12M Return (excl. last month) ⓘ | N/A | +12.05% |
| 6M Return ⓘ | N/A | 0.00% |
| Price vs. 200-Day MA ⓘ | N/A | +0.67% |
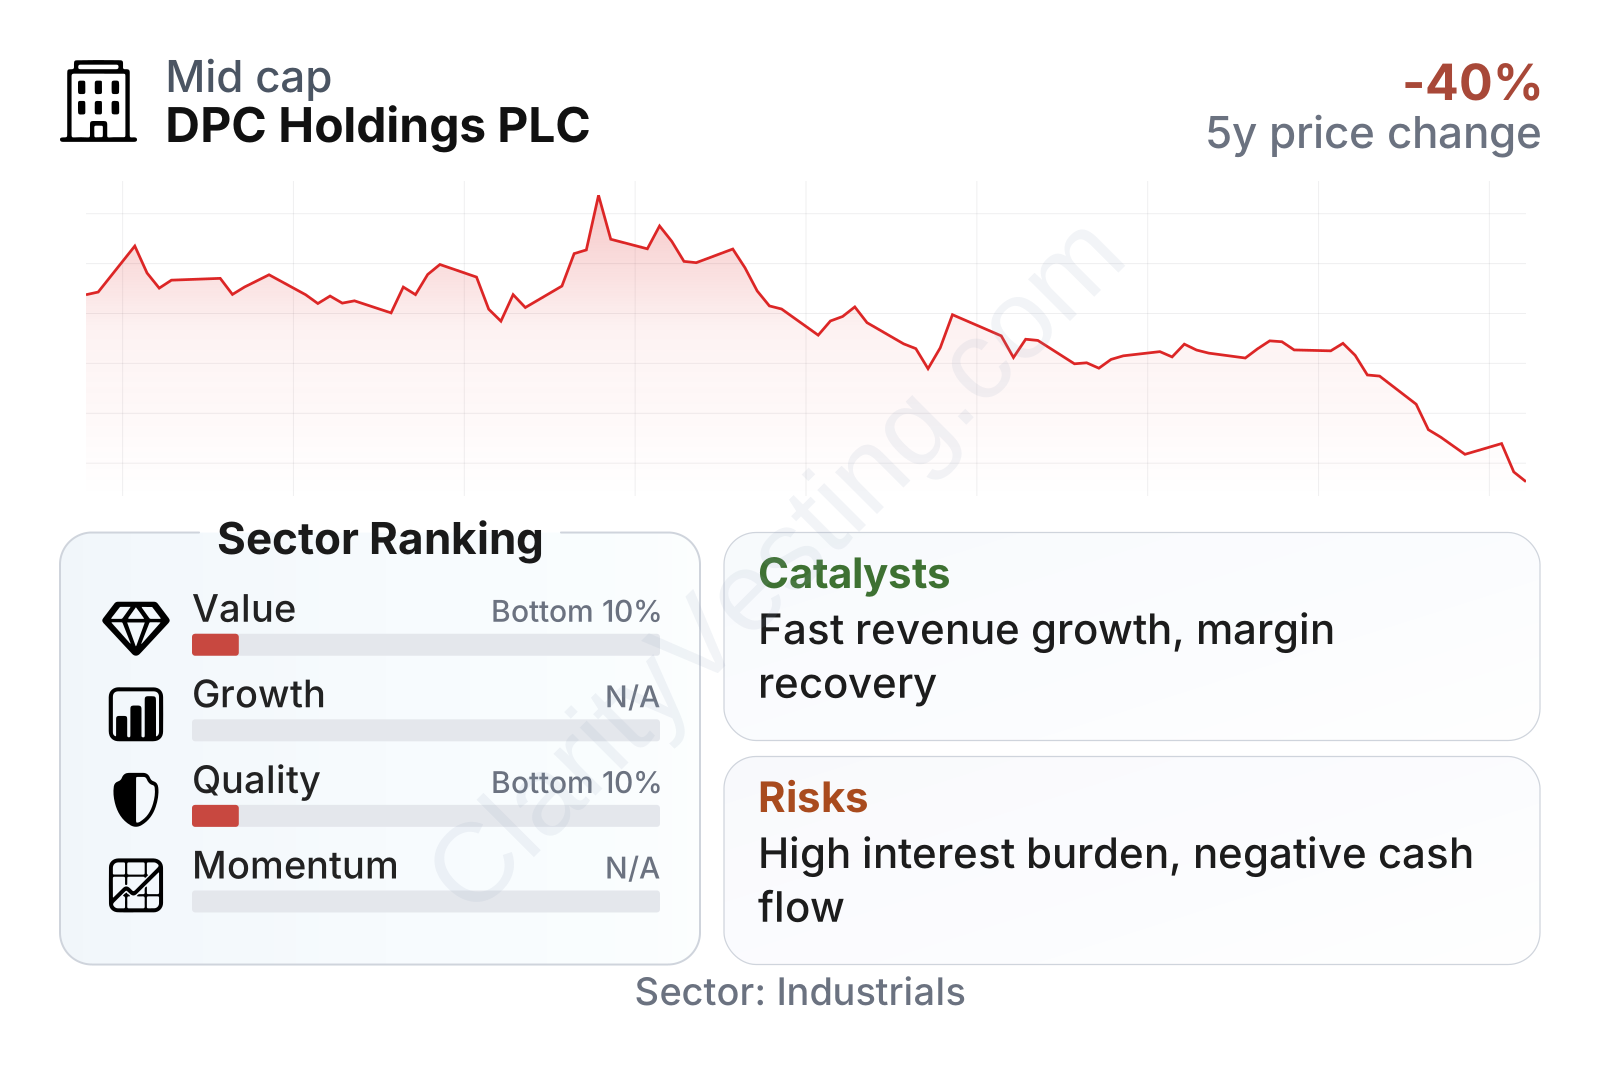
The stock has weakened over the last few months, which fits with a business profile that currently screens poorly on value and quality measures. Relative to the broader industrials and aerospace peer group, the company looks expensive on book value and weak on cash flow-based measures, while profitability is currently well below sector norms.
At the same time, one number stands out positively: revenue growth has been much stronger than the sector median, at roughly 34% year over year versus about 9% for the median peer. Balance sheet risk is somewhat mixed. Debt relative to equity is elevated at about 76%, but net debt compared with assets is negative, which usually indicates that cash offsets borrowings to some extent. Even so, negative free cash flow and negative operating margin show that the company has not yet converted growth into durable financial quality.
Growth
The company operates in a sector with attractive long-term support. Aerospace and defense demand is generally backed by structural drivers such as fleet maintenance, aircraft utilization, defense modernization, and multiyear procurement cycles. Those trends can create a favorable backdrop for suppliers that secure meaningful program positions and execute consistently.
DPC’s recent growth profile suggests it is participating in that demand environment. Revenue has been growing materially faster than the sector median, which is a useful sign because it implies either market share gains, exposure to faster-growing niches, program ramp-ups, or acquisitions. In industries like aerospace and defense, periods of strong revenue acceleration can become especially important if they lead to recurring aftermarket work or long-duration contract revenue later on.
The strategic question is whether this growth is high quality. Right now, the answer is incomplete. Operating income has remained thin while interest expense has stayed very high, so the business needs more than demand tailwinds alone. For future growth to carry greater weight, the company likely needs a combination of better operating leverage, tighter cost control, and improved financing efficiency. If that happens, the gap between top-line momentum and weak earnings could narrow meaningfully.
A practical catalyst is margin recovery. Gross profit rose from 2024 to 2025 while revenue also increased, which suggests the core business may have some room to improve before financing costs. If management can stabilize overhead and reduce the drag from interest expense, even modest operating improvement could have a visible effect on reported earnings because the current base is still depressed.
Another potential catalyst is industry backlog strength. In aerospace and defense, suppliers often benefit when larger original equipment manufacturers and defense primes increase production rates or sustain high order books. DPC’s long-term appeal therefore depends not only on its own execution, but also on how deeply it is embedded in platforms and programs that continue to grow over several years.
Risks
This article is for informational purposes only and does not constitute financial advice. Some content is AI-generated. See Disclaimer


