Stock Analysis · Dianthus Therapeutics Inc (DNTH)
Overview
Dianthus Therapeutics is a clinical-stage biotechnology company focused on severe autoimmune and inflammatory diseases. Its lead program, DNTH103, is designed to selectively block the classical complement pathway, a part of the immune system that can become overactive and damage healthy tissue. The company’s goal is to develop treatments that are effective while potentially offering more convenient dosing than some older complement-targeting drugs.
This is still a development-stage business, so its economics look very different from those of a mature pharmaceutical company. Dianthus is primarily spending money on research, clinical trials, manufacturing preparation, and corporate infrastructure rather than generating recurring product sales.
Main sources of revenue are currently limited and uneven, because the company does not yet appear to have an approved commercial product. Based on recent filings, revenue has come mainly from collaboration-related or legacy agreement activity rather than product sales.
- Collaboration or license-related revenue: approximately most or nearly all current revenue. This generally reflects accounting from external agreements rather than broad commercial demand.
- Product revenue: 0% of meaningful recurring revenue at this stage, as the company remains in clinical development.
- Other operating revenue: limited and not currently a major driver.
The business profile is therefore straightforward: Dianthus is essentially a pipeline company whose long-term value depends on whether DNTH103 and any future programs can successfully move through clinical development and eventually reach the market.
The financial flow shows a company with very small revenue compared with rapidly rising operating expenses. Research and development has become the dominant use of cash, which is typical for a biotech moving deeper into clinical trials, but it also means the investment case rests far more on future clinical outcomes than on current operating performance.
Key Figures
| Metric | Value | Sector ⓘ |
|---|---|---|
| Date | Oct 24, 2026 | |
| Context | ||
| Sector | Healthcare | |
| Industry | Biotechnology | |
| Market Cap ⓘ | $4.37B | |
| Beta ⓘ | 0.18 | |
Value (Cheapness) | ||
| P/E Ratio ⓘ | N/A | 25.42 |
| P/B Ratio ⓘ | 3.75 | 3.08 |
| FCF Yield ⓘ | -3.56% | 3.12% |
| Dividend Yield ⓘ | N/A | 1.85% |
| EBIT / EV ⓘ | -0.69% | 0.56% |
| PEG ⓘ | N/A | |
Growth (Business expansion) | ||
| Revenue Growth ⓘ | 294.30% | 7.50% |
| RPS Growth (5Y CAGR) ⓘ | -40.50% | 8.60% |
| EPS Growth (5Y CAGR) ⓘ | N/A | -17.73% |
| BVPS Growth (5Y CAGR) ⓘ | -28.62% | 3.72% |
| Margin Growth (5Y Trend) ⓘ | N/A | -0.57% |
| FCF Growth (5Y CAGR) ⓘ | N/A | 0.96% |
| DPS Growth (5Y CAGR) ⓘ | N/A | 6.69% |
Quality (Business durability) | ||
| ROIC (Latest) ⓘ | -2.73% | 3.17% |
| ROA (Latest) ⓘ | -3.34% | 2.98% |
| ROIC (5Y Median) ⓘ | -29.94% | 4.56% |
| ROA (5Y Median) ⓘ | -30.71% | 1.87% |
| Net Debt / EBIT (Latest) ⓘ | N/A | 1.34 |
| Net Debt / EBIT (5Y Median) ⓘ | N/A | 1.86 |
| Net Debt / EBITDA (Latest) ⓘ | N/A | 1.00 |
| Net Debt / Assets ⓘ | -9.01% | 5.06% |
| EBITDA / Interest ⓘ | N/A | 9.55 |
| Operating Margin (Latest) ⓘ | -1570.85% | 9.25% |
| Operating Margin (5Y Median) ⓘ | -1362.77% | 7.33% |
| Debt to Equity (Latest) ⓘ | 0.11% | 26.68% |
| Profit Margin (Latest) ⓘ | N/A | 3.34% |
| Free Cash Flow (Latest) ⓘ | -$155.71M | |
Momentum (Price trend) | ||
| 3Y Return ⓘ | +547.40% | +51.61% |
| 12M Return (excl. last month) ⓘ | +160.46% | +19.90% |
| 6M Return ⓘ | -13.98% | +10.10% |
| Price vs. 200-Day MA ⓘ | -6.33% | +6.44% |
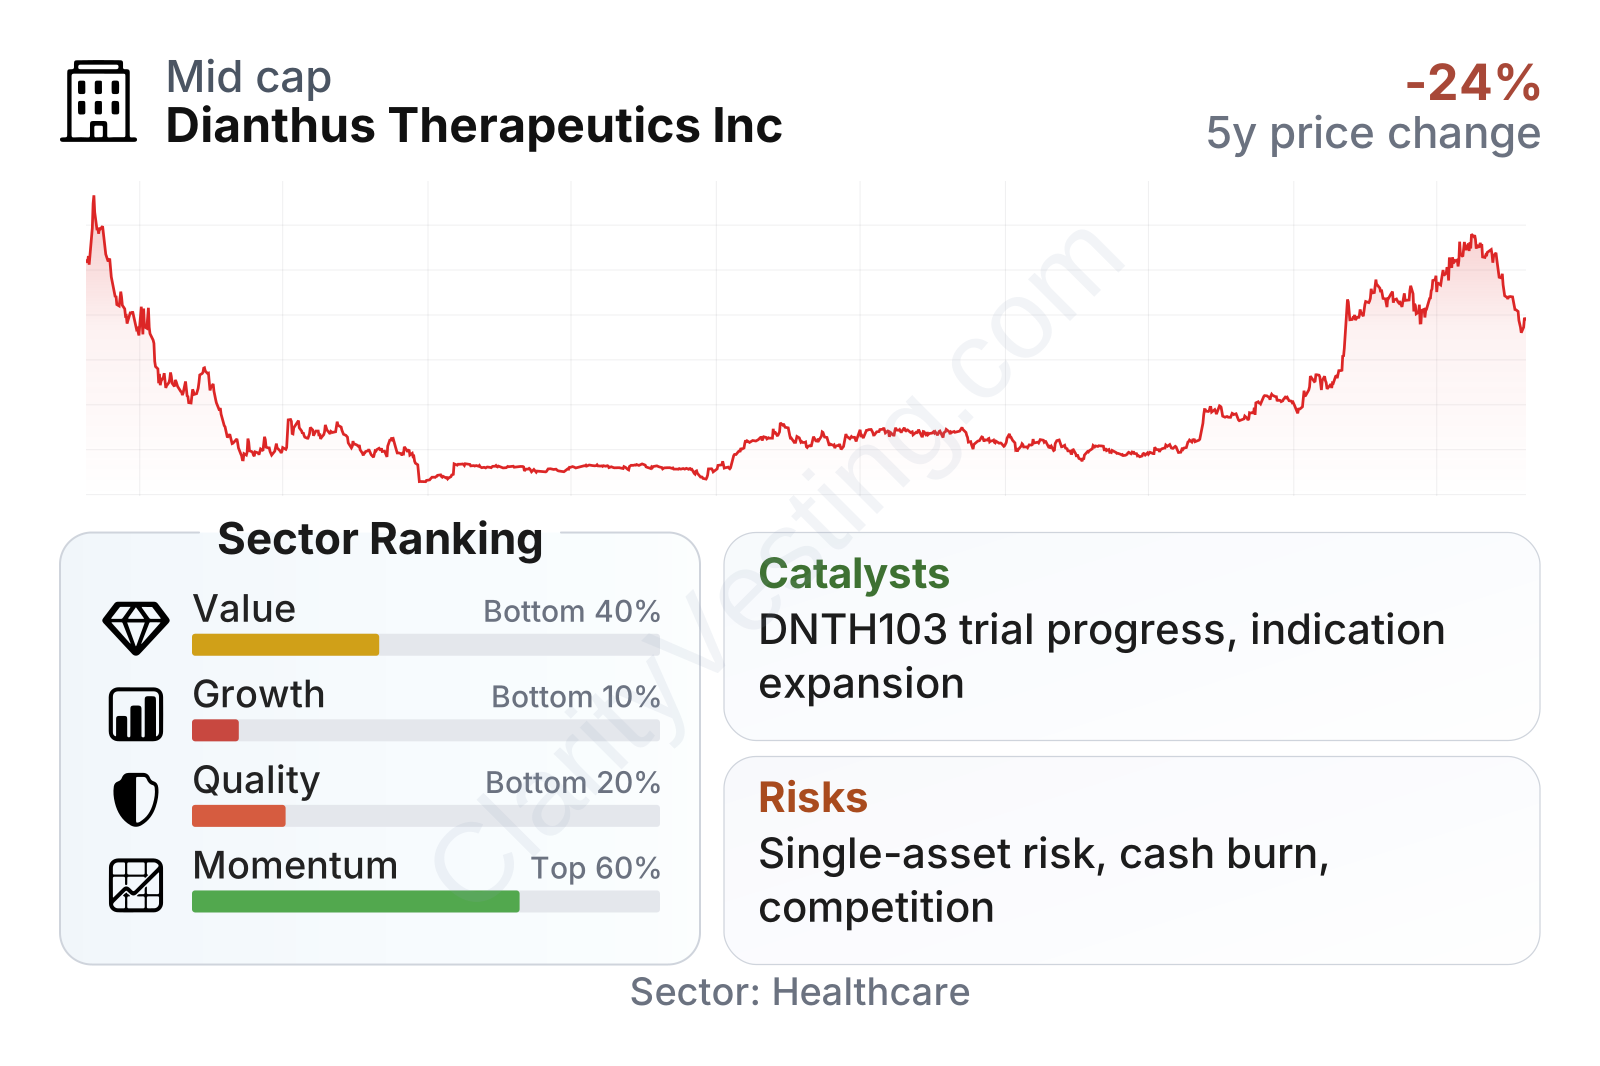
Dianthus is now a mid-sized biotech by market value, but its operating profile still looks like an early-stage developer rather than an established drug company. The table points to weak current value, quality, and growth rankings versus the broader healthcare sector, which is not unusual for a company without approved products. At the same time, momentum has been much stronger than the sector, showing that the market has recently been assigning more value to its pipeline prospects than to present-day financial results.
The stock price history also highlights how event-driven this name is. After a deep decline from its earlier levels, the shares later rebounded sharply, including a major move higher in 2026. That kind of pattern usually signals that expectations are being reset around clinical progress, financing strength, or both, rather than around stable earnings.
Growth
Dianthus operates in one of the more active areas of biotechnology: treatments for autoimmune disease and complement-mediated disorders. This is an attractive field because these diseases can be serious, chronic, and expensive to treat, and successful drugs can reach large markets if they show strong efficacy and manageable safety. The complement space has already been commercially validated by larger companies, which matters because it shows that physicians and payers are willing to support effective therapies in this category.
The company’s strategy makes sense on paper. Instead of trying to build a broad portfolio all at once, it is centered on a lead asset with a clear biological target and potential differentiation in dosing convenience. If DNTH103 can show durable disease control with less frequent treatment, that could become an important commercial advantage in chronic conditions where convenience affects adherence and physician adoption.
Revenue growth percentages look dramatic at times, but they should be interpreted carefully. Because the revenue base is very small and not driven by product sales, large swings do not necessarily indicate underlying commercial expansion. For Dianthus, the real growth question is not current revenue acceleration; it is whether the clinical pipeline can create future revenue streams that do not exist yet.
One of the strongest catalysts is continued clinical development of DNTH103 in rare neuromuscular and autoimmune indications. Public company updates in 2026 have pointed to ongoing advancement of the program and to continued effort around dose selection, trial execution, and expansion across indications. For a company at this stage, each positive operational milestone can materially change expectations for peak sales potential and partnership interest.
Cash flow remains deeply negative and has become more negative as development spending has increased. That is a normal pattern for a biotech advancing clinical programs, but it also shows that growth is being funded by cash reserves rather than by self-sustaining operations. In practical terms, Dianthus is growing its scientific and clinical footprint, not yet its commercial base.
Risks
This article is for informational purposes only and does not constitute financial advice. Some content is AI-generated. See Disclaimer


