Stock Analysis · Now Inc (DNOW)
Overview
Now Inc, known in the market as DNOW, is an industrial distributor that supplies products, equipment packages, and related services used mainly in energy, industrial, and infrastructure operations. In simple terms, the company helps customers keep complex sites running by providing pipes, valves, fittings, tools, rotating equipment, process solutions, maintenance support, digital inventory systems, and logistics services. Its role is less about owning oil or gas assets and more about being a large supply-chain and operations partner.
The business has expanded beyond its traditional oilfield roots. While energy remains central, management has been working to increase exposure to areas such as process industries, power, utilities, water, mining, and other industrial end markets. That matters because a broader customer base can reduce dependence on any single commodity cycle.
Based on company filings, investor materials, and the structure of the business, the main revenue sources can be described as follows:
- Products distribution to energy customers: approximately 60% to 70% of revenue. This includes pipes, valves, fittings, flanges, drilling and production supplies, safety products, and maintenance items used across upstream, midstream, and downstream operations.
- Process and production equipment packages: approximately 15% to 25% of revenue. This includes engineered skids, modular process packages, pumping systems, production equipment, and other higher-value integrated solutions.
- Industrial and infrastructure distribution outside core energy: approximately 10% to 20% of revenue. This includes products and services sold into general industrial, utilities, water, mining, and related markets.
- Service, automation, digital, and supply-chain support: a smaller but growing share, likely in the single-digit to low-teens percentage range depending on project mix. This covers inventory management, procurement support, repair, aftermarket support, and digital tools that help customers manage operations more efficiently.
Geographically, the United States is the largest market, with additional operations in Canada and selected international regions. The company is mid-sized by public-market standards, which can make it more sensitive to industry swings than the largest global distributors, but also more flexible when pursuing acquisitions and niche growth areas.
One visible financial pattern in recent years is that sales rose strongly from 2021 through 2025, but earnings did not follow the same path. Gross profit was fairly stable in 2023 and 2024, then came under pressure while operating costs climbed in 2025. That suggests the company has been growing volume faster than margin, an important point for any long-term assessment.
The revenue base has clearly expanded over the last several years, but the conversion from revenue into operating profit has become less efficient more recently. For a distributor, that usually points to a tougher pricing environment, a shift in business mix, acquisition integration costs, or a period of elevated operating expense.
Key Figures
| Metric | Value | Sector ⓘ |
|---|---|---|
| Date | Oct 24, 2026 | |
| Context | ||
| Sector | Industrials | |
| Industry | Industrial Distribution | |
| Market Cap ⓘ | $2.85B | |
| Beta ⓘ | 0.89 | |
Value (Cheapness) | ||
| P/E Ratio ⓘ | N/A | 22.29 |
| P/B Ratio ⓘ | 1.40 | 1.98 |
| FCF Yield ⓘ | 4.77% | 6.26% |
| Dividend Yield ⓘ | N/A | 1.92% |
| EBIT / EV ⓘ | -6.34% | 4.83% |
| PEG ⓘ | N/A | |
Growth (Business expansion) | ||
| Revenue Growth ⓘ | 108.10% | 9.30% |
| RPS Growth (5Y CAGR) ⓘ | 12.78% | 7.76% |
| EPS Growth (5Y CAGR) ⓘ | -41.18% | -13.17% |
| BVPS Growth (5Y CAGR) ⓘ | 30.95% | 6.13% |
| Margin Growth (5Y Trend) ⓘ | -4.53% | 0.74% |
| FCF Growth (5Y CAGR) ⓘ | 52.16% | 10.79% |
| DPS Growth (5Y CAGR) ⓘ | N/A | 9.41% |
Quality (Business durability) | ||
| ROIC (Latest) ⓘ | -7.30% | 10.75% |
| ROA (Latest) ⓘ | -6.83% | 5.41% |
| ROIC (5Y Median) ⓘ | 7.84% | 9.37% |
| ROA (5Y Median) ⓘ | 5.14% | 4.95% |
| Net Debt / EBIT (Latest) ⓘ | N/A | 2.04 |
| Net Debt / EBIT (5Y Median) ⓘ | -1.83 | 2.27 |
| Net Debt / EBITDA (Latest) ⓘ | N/A | 1.39 |
| Net Debt / Assets ⓘ | 13.55% | 19.27% |
| EBITDA / Interest ⓘ | N/A | 9.58 |
| Operating Margin (Latest) ⓘ | -5.22% | 10.49% |
| Operating Margin (5Y Median) ⓘ | 5.01% | 10.30% |
| Debt to Equity (Latest) ⓘ | 30.08% | 64.82% |
| Profit Margin (Latest) ⓘ | -4.63% | 6.67% |
| Free Cash Flow (Latest) ⓘ | $136.00M | |
Momentum (Price trend) | ||
| 3Y Return ⓘ | +41.35% | +67.77% |
| 12M Return (excl. last month) ⓘ | +3.18% | +12.05% |
| 6M Return ⓘ | +34.84% | 0.00% |
| Price vs. 200-Day MA ⓘ | +15.04% | +0.67% |
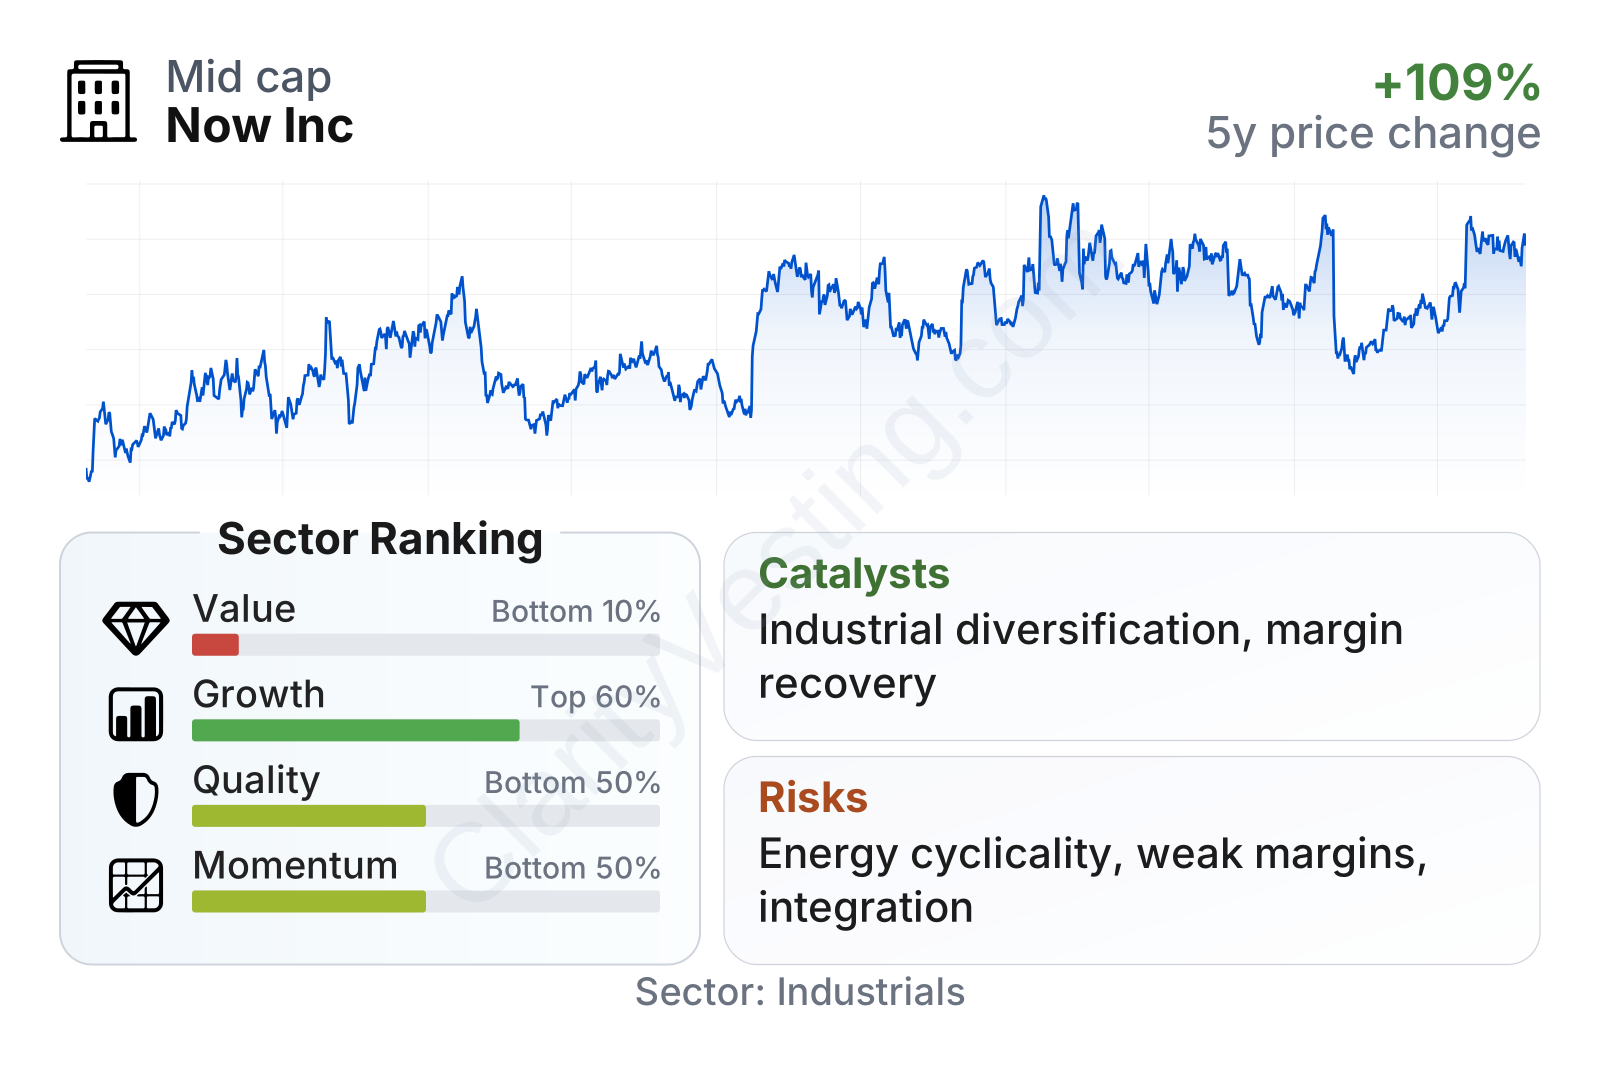
DNOW sits in the mid-cap range and its share-price volatility has been somewhat lower than the broader market, as shown by a beta below 1. The table also points to a mixed profile: growth metrics are generally stronger than many sector peers, but profitability and overall quality measures are weaker at the moment. In other words, the company has been expanding, yet that expansion has recently come with pressure on returns and margins. Valuation measures are also not especially cheap relative to that weaker profit picture, even though the balance sheet remains comparatively conservative.
Growth
DNOW operates in a sector that has reasonable long-term support, even if it is not a straight-line growth market. Energy infrastructure still requires ongoing maintenance, replacement parts, and operating supplies, and industrial customers increasingly want fewer vendors that can handle a wider portion of procurement and logistics. At the same time, the company’s push into process industries and infrastructure markets gives it a way to grow even when parts of the oilfield market slow down.
A major part of the growth case is strategy rather than pure industry tailwind. DNOW has been building a broader platform: more engineered equipment, more recurring service activity, more digital inventory tools, and more non-upstream exposure. This makes strategic sense because distribution alone can be highly competitive, while bundled services and engineered packages can create stickier customer relationships and better economics.
Recent revenue growth has been unusually strong, with the latest year-over-year readings running far above the sector median. That headline growth is eye-catching, but it needs context: when sales growth moves above 100%, it often reflects acquisition effects, project timing, or a low comparison base in addition to ordinary demand growth. It still shows that the company is expanding rapidly, but the key question is whether those sales can become durable and profitable.
Cash generation has also been positive over time, but the trend has become less comfortable. Free cash flow was very strong around 2024 and remained positive afterward, yet it appears to have stepped down materially more recently. For a long-term view, this matters because cash flow is often a cleaner sign of business health than accounting earnings alone. Positive free cash flow provides flexibility for acquisitions, debt management, and internal investment, but a declining run rate deserves attention.
Potential catalysts are tied to both execution and end-market positioning. The first is continued expansion in higher-value process solutions and integrated equipment packages, where DNOW can capture more revenue per customer relationship. The second is ongoing diversification into industrial and infrastructure categories, which can reduce reliance on upstream drilling cycles. The third is acquisition-led scale: the company has used acquisitions to broaden products, customers, and geographic reach, and further integration success could strengthen cross-selling opportunities.
Recent company updates have also highlighted the importance of larger projects, broader product breadth, and supply-chain capabilities. Those are meaningful because customers in energy and industry increasingly care about reliability, lead times, and vendor simplification. If DNOW can translate that into repeat business instead of one-time volume spikes, the growth profile becomes more compelling.
Risks
This article is for informational purposes only and does not constitute financial advice. Some content is AI-generated. See Disclaimer


