Stock Analysis · Denali Therapeutics Inc (DNLI)
Overview
Denali Therapeutics is a biotechnology company focused on medicines for neurodegenerative and lysosomal diseases. In simple terms, it is trying to develop treatments for disorders such as Alzheimer’s disease, Parkinson’s disease, amyotrophic lateral sclerosis, frontotemporal dementia, and Hunter syndrome. Its distinguishing idea is that many brain diseases are hard to treat because drugs struggle to cross the blood-brain barrier, so Denali has built delivery technologies designed to move therapies more effectively into the brain.
Unlike a mature pharmaceutical company, Denali does not yet have recurring product sales from approved medicines. Its business model is still centered on research, clinical development, and partnerships with larger drug companies. That makes reported revenue uneven from year to year, because it depends mainly on milestone payments, licensing arrangements, collaboration accounting, and other partner-related items rather than steady commercial demand.
The main revenue sources are currently concentrated in collaboration-related income. Based on recent annual filings, the mix can be summarized this way:
- Collaboration and license revenue: approximately 100% of reported revenue in years when revenue is recognized. This includes upfront payments recognized over time, development milestones, and other amounts tied to strategic partnerships.
- Product revenue: 0% at this stage, as Denali has not yet built a marketed product base that generates recurring sales.
- Other revenue: minimal to none relative to the core collaboration line.
This concentration is important. Denali’s income can rise sharply when a partner payment is booked and then fall back to zero when no comparable event occurs. That pattern is visible in recent years: revenue climbed meaningfully in 2023, then dropped to zero in 2024 and 2025, while research spending stayed high. The result is a company whose economic value depends far more on pipeline progress than on current sales.
The cost structure also shows where management is placing its bets. Research and development has consistently been the largest expense, representing roughly 75% to 85% of operating expenses in recent years, while selling, general, and administrative costs have remained much smaller. For a development-stage biotech, that is typical and indicates that most resources are still going into clinical programs rather than commercialization.
The broader financial flow highlights a highly partnership-driven revenue profile and a research-heavy expense base. Revenue was meaningful in 2023 because of collaboration recognition, but it disappeared in the following two years while operating expenses stayed near the same elevated range. That is a reminder that Denali is still being valued mostly on future drug potential, not on present operating earnings.
Key Figures
| Metric | Value | Sector ⓘ |
|---|---|---|
| Date | Oct 24, 2026 | |
| Context | ||
| Sector | Healthcare | |
| Industry | Biotechnology | |
| Market Cap ⓘ | $2.99B | |
| Beta ⓘ | 1.02 | |
Value (Cheapness) | ||
| P/E Ratio ⓘ | N/A | 25.42 |
| P/B Ratio ⓘ | 4.19 | 3.08 |
| FCF Yield ⓘ | -14.65% | 3.12% |
| Dividend Yield ⓘ | N/A | 1.85% |
| EBIT / EV ⓘ | -19.73% | 0.56% |
| PEG ⓘ | N/A | |
Growth (Business expansion) | ||
| Revenue Growth ⓘ | -100.00% | 7.50% |
| RPS Growth (5Y CAGR) ⓘ | N/A | 8.60% |
| EPS Growth (5Y CAGR) ⓘ | -15.71% | -17.73% |
| BVPS Growth (5Y CAGR) ⓘ | -7.58% | 3.72% |
| Margin Growth (5Y Trend) ⓘ | N/A | -0.57% |
| FCF Growth (5Y CAGR) ⓘ | N/A | 0.96% |
| DPS Growth (5Y CAGR) ⓘ | N/A | 6.69% |
Quality (Business durability) | ||
| ROIC (Latest) ⓘ | -43.10% | 3.17% |
| ROA (Latest) ⓘ | -46.21% | 2.98% |
| ROIC (5Y Median) ⓘ | -25.37% | 4.56% |
| ROA (5Y Median) ⓘ | -22.76% | 1.87% |
| Net Debt / EBIT (Latest) ⓘ | N/A | 1.34 |
| Net Debt / EBIT (5Y Median) ⓘ | N/A | 1.86 |
| Net Debt / EBITDA (Latest) ⓘ | N/A | 1.00 |
| Net Debt / Assets ⓘ | -15.03% | 5.06% |
| EBITDA / Interest ⓘ | N/A | 9.55 |
| Operating Margin (Latest) ⓘ | -14188.37% | 9.25% |
| Operating Margin (5Y Median) ⓘ | -300.54% | 7.33% |
| Debt to Equity (Latest) ⓘ | 3.29% | 26.68% |
| Profit Margin (Latest) ⓘ | N/A | 3.34% |
| Free Cash Flow (Latest) ⓘ | -$437.46M | |
Momentum (Price trend) | ||
| 3Y Return ⓘ | -0.21% | +51.61% |
| 12M Return (excl. last month) ⓘ | +62.16% | +19.90% |
| 6M Return ⓘ | -7.85% | +10.10% |
| Price vs. 200-Day MA ⓘ | -11.95% | +6.44% |
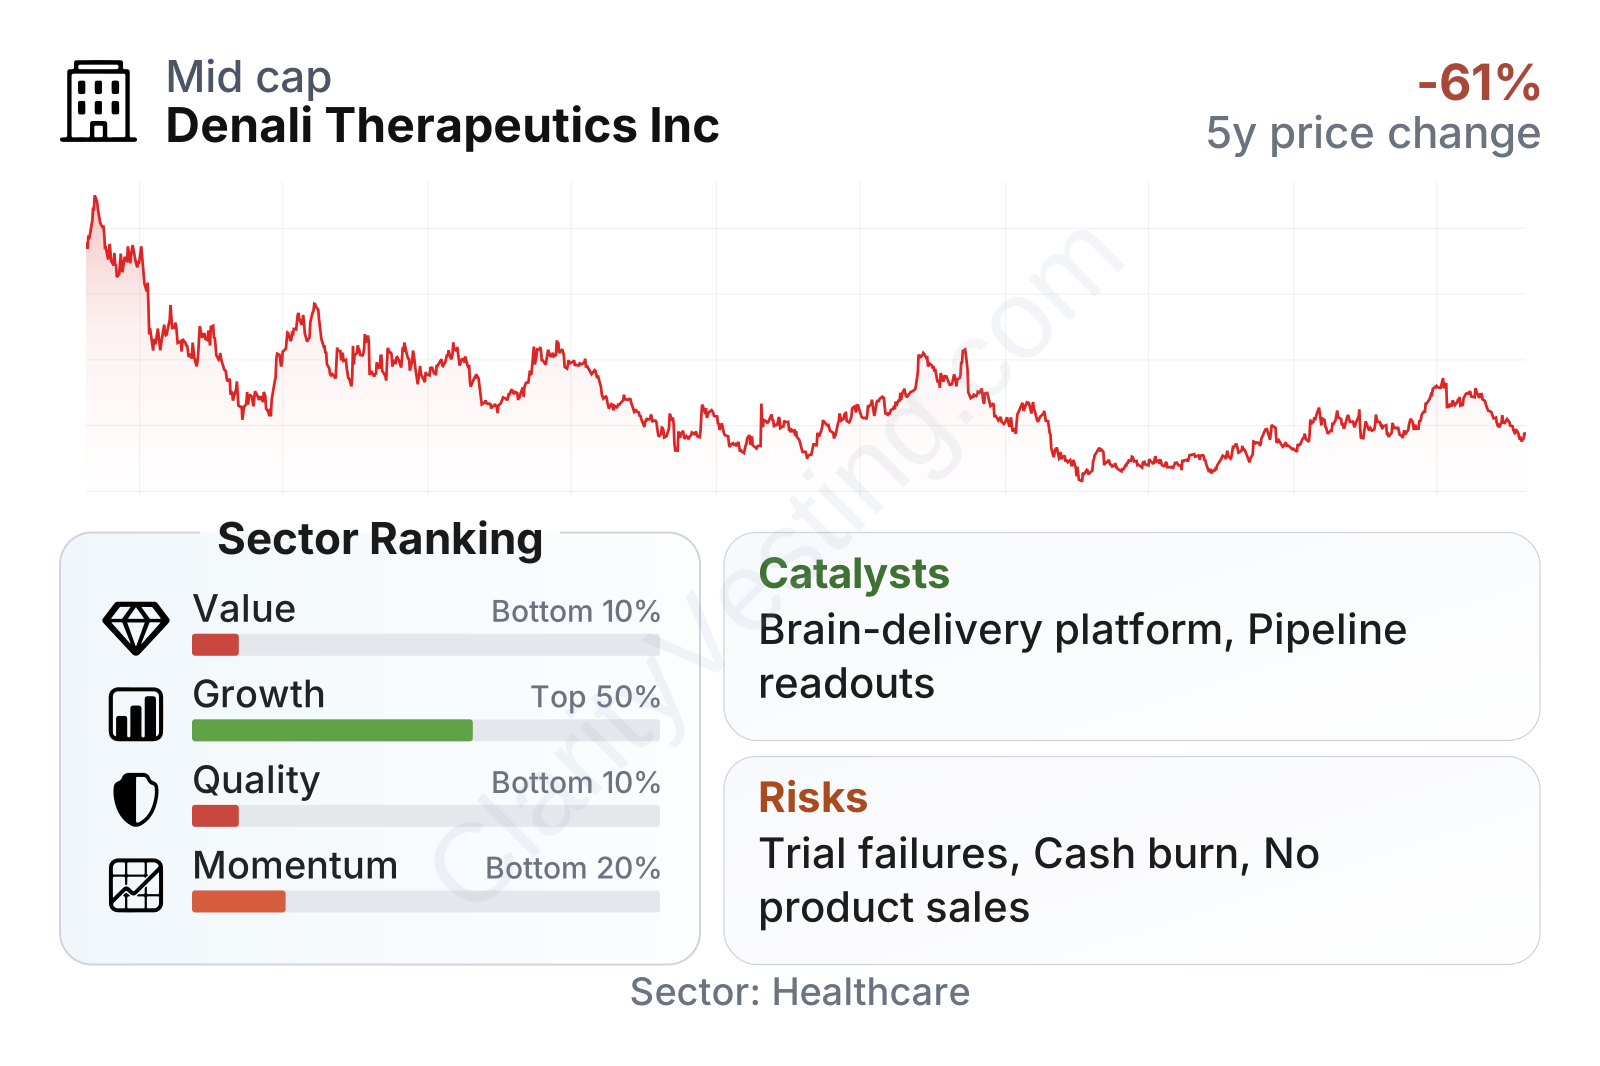
Denali sits in the mid-cap range within biotech, with share price behavior that has been volatile over the past several years. After a long decline from 2021 into 2025, the stock rebounded strongly into 2026, which suggests sentiment has improved but remains tied to clinical and partnership developments. The latest factor table presents a mixed picture: growth indicators are around the middle of the healthcare group, but value and quality metrics rank weakly because the company is still unprofitable and consuming cash. Momentum has improved over the last year, though the longer-term stock record still lags much of the sector.
Growth
Denali operates in a sector with very large long-term demand potential. Neurodegenerative diseases remain one of the biggest unmet needs in medicine, and successful treatments can create very large commercial opportunities because these conditions are common, serious, and often poorly served by existing therapies. That said, this is also one of the hardest areas in biotechnology, with high scientific risk and long development timelines.
Denali’s strategy is logical for future growth because it is not trying to compete only with a single drug candidate. It is building around a platform approach: drug discovery for the brain, blood-brain barrier transport technology, enzyme replacement programs for lysosomal disorders, and partnerships that can help finance development. This gives the company several ways to create value if its science works, including milestone income, licensing economics, and eventually product commercialization.
A major growth catalyst is the company’s clinical pipeline. Denali has highlighted programs across neurodegeneration and rare disease, including transport vehicle-enabled biologics and enzyme replacement approaches designed to reach the brain more effectively. In biotech, a single positive late-stage or proof-of-concept readout can materially change how the market values a company, especially when the underlying disease area is large or underserved.
Strategic partnerships are another important growth engine. Denali has worked with larger pharmaceutical companies including Sanofi, Takeda, Biogen, and others over time. These relationships can validate the platform, reduce financing pressure, and expand the number of shots on goal without requiring Denali to fund everything alone. For a company without commercial revenue, that external validation matters.
Reported revenue growth has been extremely uneven, which is normal for a company relying on collaboration accounting rather than product sales. Strong spikes and sharp drops do not necessarily reflect changes in medical demand; they mostly reflect when payments and accounting recognition occur. That makes headline growth less useful here than pipeline progress and partner activity.
Cash generation remains negative, with free cash flow deeply below zero over multiple years. Even so, the spending pattern is not surprising for a research-stage biotech pursuing several clinical programs at once. The key question for long-term growth is not whether current cash flow is positive, because it is not, but whether the company can turn high research spending into clinically meaningful assets that partners, regulators, and eventually prescribers value.
Recent company updates have continued to center on pipeline execution, regulatory interactions, and advancement of transport-vehicle-enabled programs. If Denali can produce convincing clinical evidence that its brain-delivery approach improves outcomes or expands treatable conditions, that would represent a significant opportunity because the technology could potentially be used across multiple programs rather than only one medicine.
Risks
This article is for informational purposes only and does not constitute financial advice. Some content is AI-generated. See Disclaimer


