Stock Analysis · Dorchester Minerals LP (DMLP)
Overview
Dorchester Minerals LP is a publicly traded master limited partnership focused on owning oil and natural gas mineral interests, royalty properties, and net profits interests across the United States. In simple terms, it usually does not drill wells itself. Instead, it owns rights tied to land and receives a share of production revenue when other operators develop those properties. That makes Dorchester different from a typical exploration and production company: it is much more of an asset owner and cash collector than a capital-intensive driller.
The partnership’s revenue is mainly tied to commodity production from its acreage and to the prices of oil, natural gas, and natural gas liquids. Based on its business model and disclosures, the main revenue sources can be described as follows:
- Royalty income: generally the largest source of revenue. This comes from mineral and royalty interests where third-party operators produce hydrocarbons and Dorchester receives a share of gross revenue with limited operating cost exposure.
- Net profits interest income: another important source. These interests pay Dorchester a contractual share of profits from specified properties after certain costs are deducted, so this stream can be more sensitive to operator spending and cost inflation than royalty income.
- Lease bonus and related income: a smaller and more irregular source. This can include payments received when operators lease acreage for future drilling activity.
Because Dorchester is structured around passive ownership of mineral and royalty assets, its expense base is much lighter than many energy producers. Over the last several years, a large share of revenue has flowed through to operating income and net income, even though that conversion weakened in 2025 when costs of revenue rose sharply. The business remains relatively simple: own acreage, collect cash from production, keep overhead low, and distribute a large portion of available cash to unitholders.
The long-term pattern shows a business with consistently modest overhead and strong gross profitability, but with earnings that still move materially with commodity prices and production mix. Revenue stayed around the mid-$100 million range in recent years, while net income fell noticeably in 2025 after stronger levels in 2022 through 2024.
Key Figures
| Metric | Value | Sector ⓘ |
|---|---|---|
| Date | Oct 03, 2026 | |
| Context | ||
| Sector | Energy | |
| Industry | Oil & Gas E&P | |
| Market Cap ⓘ | $1.40B | |
| Beta ⓘ | 0.52 | |
Value (Cheapness) | ||
| P/E Ratio ⓘ | 16.22 | 14.47 |
| P/B Ratio ⓘ | 4.46 | 1.70 |
| FCF Yield ⓘ | 11.18% | 8.66% |
| Dividend Yield ⓘ | 11.27% | 3.77% |
| EBIT / EV ⓘ | 6.44% | 7.46% |
| PEG ⓘ | 0.83 | |
Growth (Business expansion) | ||
| Revenue Growth ⓘ | 73.10% | 27.35% |
| RPS Growth (5Y CAGR) ⓘ | 4.74% | 6.75% |
| EPS Growth (5Y CAGR) ⓘ | -23.93% | -15.45% |
| BVPS Growth (5Y CAGR) ⓘ | 12.69% | 5.85% |
| Margin Growth (5Y Trend) ⓘ | -37.59% | 0.75% |
| FCF Growth (5Y CAGR) ⓘ | 17.16% | 3.62% |
| DPS Growth (5Y CAGR) ⓘ | 14.85% | 16.85% |
Quality (Business durability) | ||
| ROIC (Latest) ⓘ | 22.18% | 11.33% |
| ROA (Latest) ⓘ | 27.25% | 6.03% |
| ROIC (5Y Median) ⓘ | 26.35% | 10.16% |
| ROA (5Y Median) ⓘ | 59.69% | 5.34% |
| Net Debt / EBIT (Latest) ⓘ | -0.79 | 1.62 |
| Net Debt / EBIT (5Y Median) ⓘ | -0.40 | 1.91 |
| Net Debt / EBITDA (Latest) ⓘ | -0.43 | 1.06 |
| Net Debt / Assets ⓘ | -21.98% | 17.29% |
| EBITDA / Interest ⓘ | N/A | 9.64 |
| Operating Margin (Latest) ⓘ | 45.45% | 16.32% |
| Operating Margin (5Y Median) ⓘ | 69.67% | 19.53% |
| Debt to Equity (Latest) ⓘ | 1.15% | 54.41% |
| Profit Margin (Latest) ⓘ | 45.30% | 8.79% |
| Free Cash Flow (Latest) ⓘ | $156.69M | |
Momentum (Price trend) | ||
| 3Y Return ⓘ | +34.32% | +62.93% |
| 12M Return (excl. last month) ⓘ | +29.82% | +44.83% |
| 6M Return ⓘ | +10.34% | -1.62% |
| Price vs. 200-Day MA ⓘ | +10.73% | +5.18% |
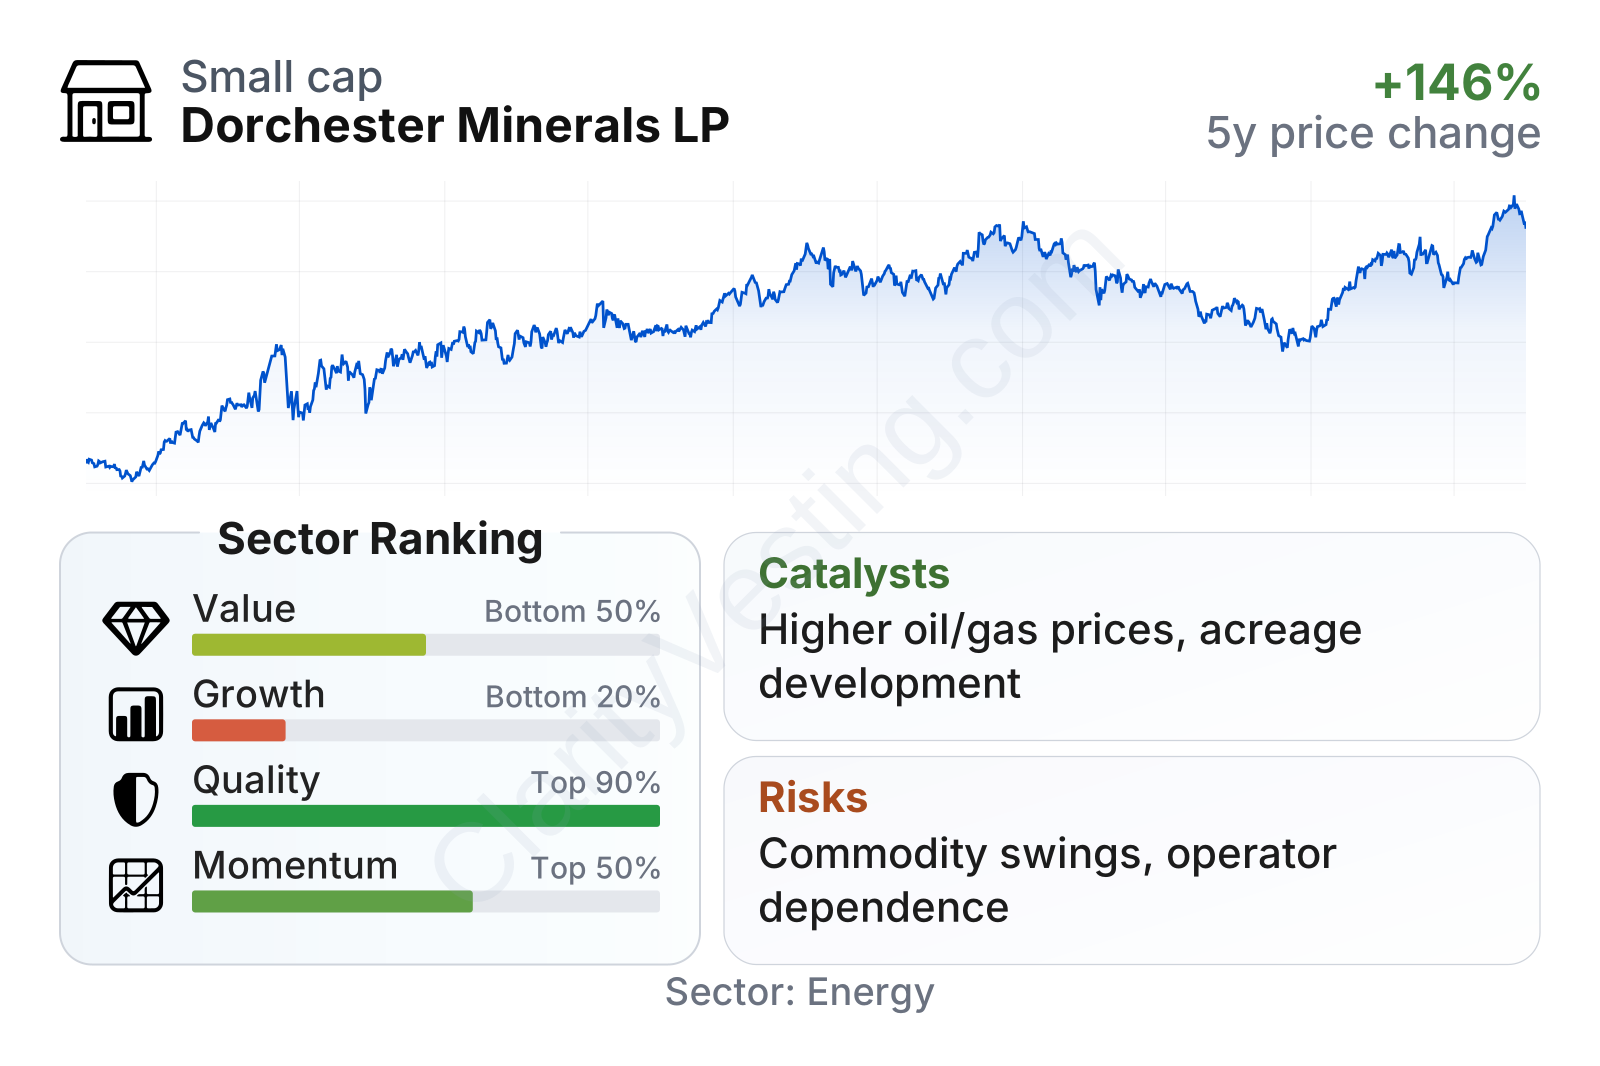
Dorchester is a small-cap energy partnership with unusually strong balance-sheet quality for its sector. Debt is close to negligible, profitability remains far above industry norms, and free cash flow generation is solid. The weaker point is growth consistency: recent year-over-year revenue rebounded strongly, but the longer five-year record is much less impressive, which helps explain why the growth profile ranks low versus peers. On valuation, the picture is mixed. The cash yield and distribution yield stand out, while the price-to-book ratio is high for the sector.
The stock’s longer-term trading record shows meaningful appreciation from 2021 levels, but with clear swings tied to energy prices. Its beta is low at roughly 0.5, suggesting it has historically been less volatile than the broader market, although that does not remove the underlying commodity exposure.
Growth
Dorchester operates in a sector that is mature rather than structurally high-growth. Long-term demand for oil and gas is still substantial, especially for U.S. natural gas, but the industry’s economics remain cyclical. For Dorchester, growth does not mainly come from building new drilling programs internally. It comes from acquiring additional mineral and royalty interests, benefiting from more development activity by third-party operators on its land, and gaining from favorable commodity prices.
This strategy makes sense for a partnership with a low-cost structure. It can expand without taking on the full capital burden and operational risk of drilling wells itself. That is a real advantage in a sector where cost overruns and debt have hurt many producers. Dorchester’s model is especially effective when operators want access to productive acreage and when U.S. shale regions remain active.
Recent revenue growth has been volatile, which is normal for a mineral-owner model. The latest year-over-year reading is very strong, well above the sector median, but the path has not been smooth. There were several quarters of contraction mixed with rebounds, showing that short-term growth depends heavily on commodity prices, production timing, and operator activity rather than steady internal expansion.
Free cash flow has remained healthy over time, staying comfortably above $100 million in recent periods even after coming down from earlier peaks. That resilience matters because cash flow is the foundation of Dorchester’s quarterly distributions and of any future acquisitions. The partnership’s five-year free cash flow growth rate is notably ahead of the sector median, which is one of the more encouraging parts of the financial profile.
A practical catalyst for future growth is industry consolidation and continued drilling on acreage already owned by the partnership. Dorchester does not need to be the operator to benefit; it only needs capable producers to keep developing the underlying properties. Another catalyst is commodity strength, especially if oil and natural gas prices remain supportive. In that setting, the partnership’s operating leverage can translate into larger cash distributions without major balance-sheet strain.
Risks
This article is for informational purposes only and does not constitute financial advice. Some content is AI-generated. See Disclaimer