Stock Analysis · Dollar Tree Inc (DLTR)
Overview
Dollar Tree Inc. is a discount retailer focused on low-price everyday merchandise in North America. The company operates thousands of stores and serves budget-conscious shoppers looking for consumables, seasonal goods, household basics, health and beauty items, party supplies, and other general merchandise. In recent years, the business has been going through a major transition as management works to improve store standards, simplify operations, and reshape the company around the Dollar Tree banner.
As of fiscal 2025, the company reported two operating segments, although that structure is changing because Dollar Tree has entered into an agreement to sell the Family Dollar business. This matters because Family Dollar has weighed on profitability for years, while the core Dollar Tree banner has generally produced stronger margins and better returns.
The company’s main revenue sources can be summarized as follows:
- Dollar Tree segment: approximately 52% to 53% of fiscal 2025 net sales. This segment includes multi-price discount stores selling consumables, variety merchandise, seasonal products, party goods, and household essentials.
- Family Dollar segment: approximately 47% to 48% of fiscal 2025 net sales before the announced divestiture. Family Dollar stores focus more heavily on neighborhood convenience and everyday basics such as food, household products, and personal care.
Operationally, the business remains a large-scale retailer, but the earnings profile is uneven. Revenue has continued to rise, while net income has been more volatile because of impairments, restructuring, and pressure tied largely to Family Dollar. The broader pattern is that sales growth has held up better than headline earnings.
Revenue mix and cost structure: recent results show a business with a sizable merchandise margin but also substantial store operating and overhead costs, which is typical for brick-and-mortar discount retail. The latest annual profile points to recovering profitability after a period of losses driven by special charges, while interest expense remains manageable relative to operating earnings.
The most notable trend is that revenue has moved higher again and net income has rebounded after unusually weak years. Gross profit has also recovered, suggesting the underlying retail engine is healthier than the headline losses from prior periods implied.
Key Figures
| Metric | Value | Sector ⓘ |
|---|---|---|
| Date | Oct 03, 2026 | |
| Context | ||
| Sector | Consumer Defensive | |
| Industry | Discount Stores | |
| Market Cap ⓘ | $21.77B | |
| Beta ⓘ | 0.66 | |
Value (Cheapness) | ||
| P/E Ratio ⓘ | 13.98 | 18.16 |
| P/B Ratio ⓘ | 6.31 | 1.27 |
| FCF Yield ⓘ | 8.51% | 12.39% |
| Dividend Yield ⓘ | N/A | 2.83% |
| EBIT / EV ⓘ | 7.86% | 6.45% |
| PEG ⓘ | 1.41 | |
Growth (Business expansion) | ||
| Revenue Growth ⓘ | 7.00% | 3.80% |
| RPS Growth (5Y CAGR) ⓘ | -4.88% | 6.20% |
| EPS Growth (5Y CAGR) ⓘ | -21.23% | -14.64% |
| BVPS Growth (5Y CAGR) ⓘ | -14.28% | 3.26% |
| Margin Growth (5Y Trend) ⓘ | 1.95% | -0.25% |
| FCF Growth (5Y CAGR) ⓘ | 35.98% | 4.65% |
| DPS Growth (5Y CAGR) ⓘ | 195.52% | 6.86% |
Quality (Business durability) | ||
| ROIC (Latest) ⓘ | 25.88% | 12.58% |
| ROA (Latest) ⓘ | 11.65% | 6.35% |
| ROIC (5Y Median) ⓘ | 19.09% | 10.36% |
| ROA (5Y Median) ⓘ | 6.26% | 5.44% |
| Net Debt / EBIT (Latest) ⓘ | 3.02 | 1.91 |
| Net Debt / EBIT (5Y Median) ⓘ | 1.54 | 2.32 |
| Net Debt / EBITDA (Latest) ⓘ | 2.29 | 1.36 |
| Net Debt / Assets ⓘ | 47.13% | 21.25% |
| EBITDA / Interest ⓘ | 38.92 | 9.61 |
| Operating Margin (Latest) ⓘ | 10.90% | 8.96% |
| Operating Margin (5Y Median) ⓘ | 8.83% | 9.53% |
| Debt to Equity (Latest) ⓘ | 223.95% | 71.66% |
| Profit Margin (Latest) ⓘ | 8.04% | 5.40% |
| Free Cash Flow (Latest) ⓘ | $1.85B | |
Momentum (Price trend) | ||
| 3Y Return ⓘ | +6.43% | +15.25% |
| 12M Return (excl. last month) ⓘ | +17.49% | +2.63% |
| 6M Return ⓘ | +7.15% | +2.43% |
| Price vs. 200-Day MA ⓘ | -3.60% | +0.43% |
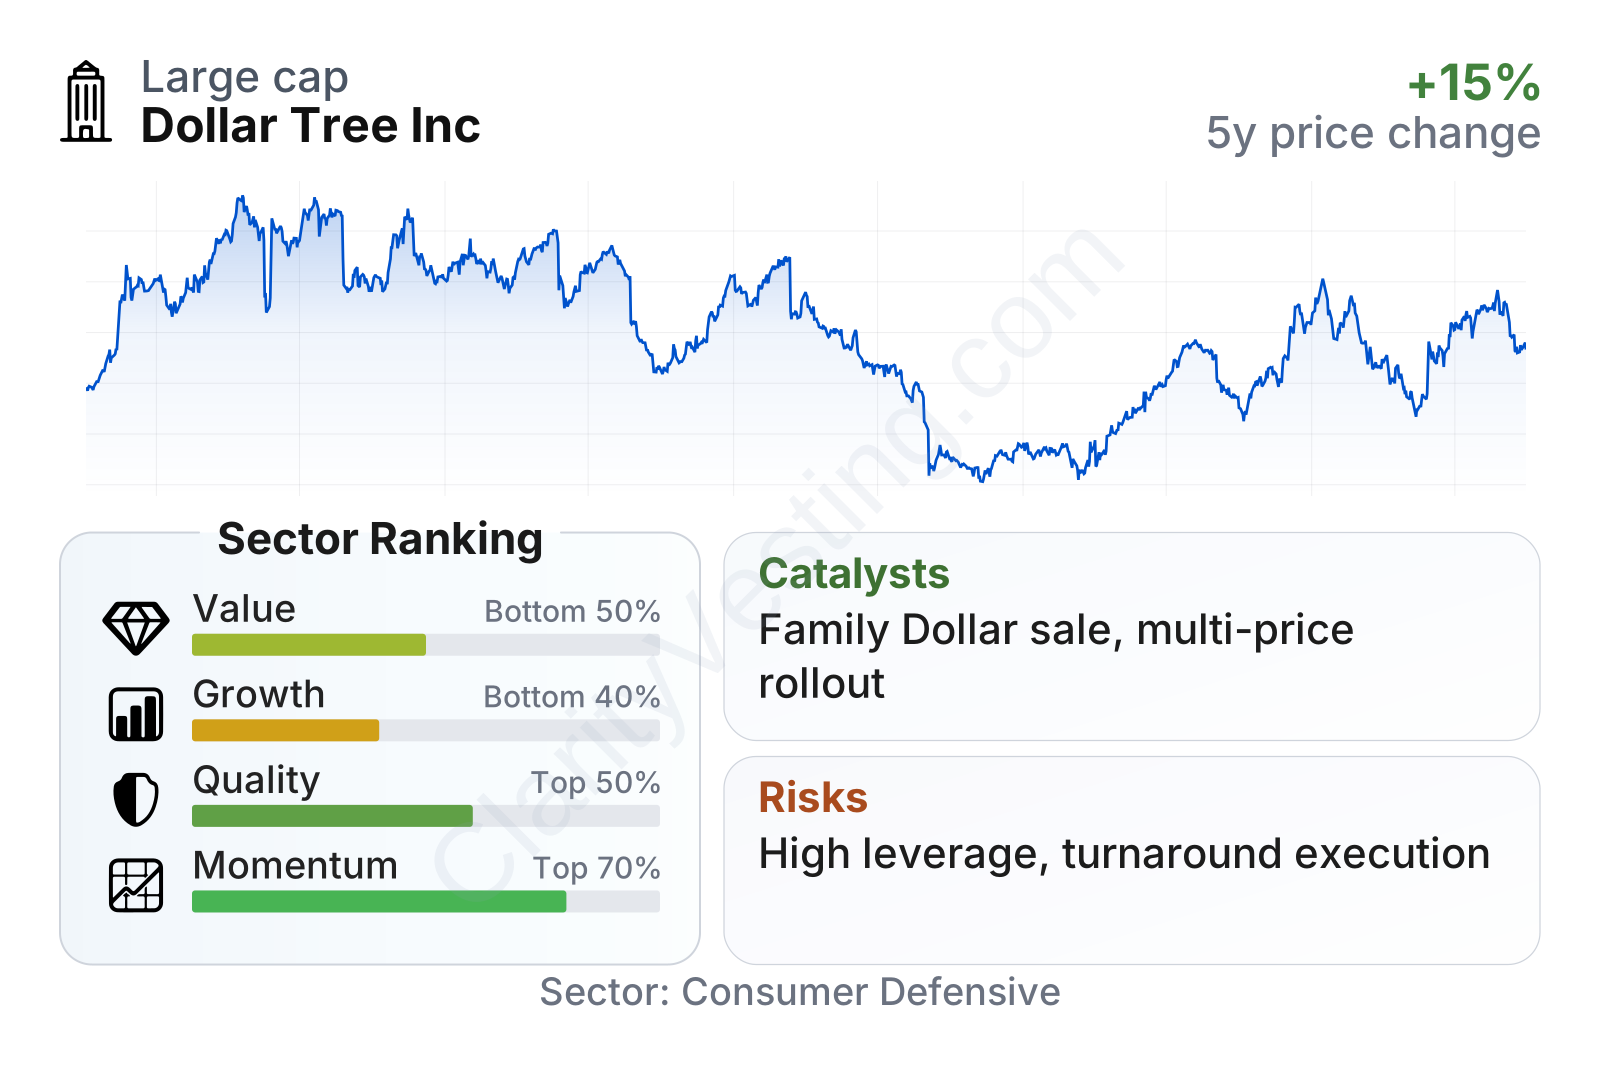
Dollar Tree sits in the large-cap range and has shown lower share-price volatility than the broader market, as reflected in a beta well below 1. On valuation, its earnings multiple is below the sector median, but the overall value profile is not especially strong because the company does not pay a dividend and its price-to-book ratio is elevated. Quality metrics are more encouraging: returns on capital and assets are above sector medians, and current operating and profit margins are also ahead of many peers. Growth is more mixed. Recent year-over-year revenue growth has been solid, but longer-term per-share growth and earnings trends remain weak because of operational disruption and charges over the last several years. Momentum has improved over the last year, although the longer three-year share-price record is still less impressive.
Growth
Dollar Tree operates in a part of retail that tends to remain relevant across economic cycles. Discount stores can perform well when consumers are under pressure because shoppers trade down to cheaper alternatives, but they can also keep traffic in steadier periods by offering convenience and low ticket prices. That makes the sector structurally resilient, even if not always fast-growing.
The company’s current strategy appears more coherent than it did a few years ago. The biggest strategic shift is the move away from the lower-performing Family Dollar business and the sharper focus on the Dollar Tree brand. That has the potential to improve management focus, simplify execution, and lift margins over time. The multi-price strategy is another important lever. Dollar Tree historically built its identity around fixed-price points, but broadening price ranges gives the chain more flexibility to protect margins and widen its assortment.
Recent sales growth has been running around the high-single-digit range, which is better than the sector median and suggests customer demand has held up. Some earlier swings in the growth trend reflect portfolio changes and unusual comparisons, so the cleaner takeaway is that the core business has recently returned to a steadier expansion path.
Cash generation is another encouraging point. Free cash flow has increased sharply versus levels seen a few years ago, even after easing somewhat from a recent peak. For a retailer, stronger cash flow matters because it supports store investments, supply-chain improvements, debt service, and strategic flexibility during a restructuring period.
A major catalyst is the Family Dollar sale. If completed and executed well, it could remove a long-standing drag on performance and make reported results easier to understand. Another catalyst is store optimization: management has been closing weaker locations and investing in better-performing formats. If the Dollar Tree banner continues to grow while maintaining margin recovery, the company could emerge as a simpler and more profitable discount retail business than the one the market has been evaluating in recent years.
Risks
This article is for informational purposes only and does not constitute financial advice. Some content is AI-generated. See Disclaimer