Stock Analysis · Dolby Laboratories (DLB)
Overview
Dolby Laboratories develops audio, imaging, and entertainment technologies that are built into movies, televisions, smartphones, PCs, cars, game consoles, and streaming services. Rather than mainly selling consumer devices under its own name, the company mostly earns money by creating technology standards and licensing them to device makers, content creators, software platforms, broadcasters, cinemas, and automotive companies. Its best-known brands are Dolby Atmos for immersive sound, Dolby Vision for high-dynamic-range video, and legacy technologies such as Dolby Audio and Dolby Cinema.
This business model is important for long-term analysis because it tends to be asset-light, highly profitable, and cash generative. Once Dolby’s technologies are adopted across hardware and content ecosystems, they can keep producing royalty revenue for years. The trade-off is that results depend heavily on unit volumes in consumer electronics and on the pace at which new formats spread across streaming, cinema, gaming, and automotive markets.
Based on recent annual reporting, Dolby’s revenue is primarily organized around licensing, with a much smaller contribution from products and services.
- Licensing revenue: about 91% to 93% of total revenue. This includes royalties and fixed-fee arrangements tied to Dolby technologies embedded in televisions, mobile devices, PCs, gaming products, consumer electronics, broadcast equipment, streaming services, cinema solutions, and increasingly automobiles.
- Products and services: about 7% to 9% of total revenue. This includes cinema-related products, imaging and audio solutions, support, maintenance, and professional services connected to Dolby’s technologies and entertainment offerings.
Within licensing, the largest end markets have historically been broadcast, mobile, and consumer electronics, with additional contributions from PCs, automotive, and other categories. Dolby does not always provide a precise public split for every end market each quarter, but licensing is clearly the economic core of the business.
The company’s operating profile also stands out: direct costs are relatively low compared with revenue, while research and development and selling expenses are the main uses of cash inside the income statement. That reflects a technology-licensing company that must keep investing to maintain relevance across changing media formats and devices.
Over the last several years, revenue and gross profit have remained strong, while spending on research and development and selling efforts has stayed substantial. That pattern fits a business built on intellectual property: modest production costs, high gross margins, and a need for continuous innovation and ecosystem support.
Key Figures
| Metric | Value | Sector ⓘ |
|---|---|---|
| Date | Oct 24, 2026 | |
| Context | ||
| Sector | Industrials | |
| Industry | Specialty Business Services | |
| Market Cap ⓘ | $5.84B | |
| Beta ⓘ | 0.78 | |
Value (Cheapness) | ||
| P/E Ratio ⓘ | 26.51 | 22.29 |
| P/B Ratio ⓘ | 2.30 | 1.98 |
| FCF Yield ⓘ | 5.90% | 6.26% |
| Dividend Yield ⓘ | 2.36% | 1.92% |
| EBIT / EV ⓘ | 5.60% | 4.83% |
| PEG ⓘ | 2.08 | |
Growth (Business expansion) | ||
| Revenue Growth ⓘ | -3.30% | 9.30% |
| RPS Growth (5Y CAGR) ⓘ | 3.11% | 7.76% |
| EPS Growth (5Y CAGR) ⓘ | -2.39% | -13.17% |
| BVPS Growth (5Y CAGR) ⓘ | 1.99% | 6.13% |
| Margin Growth (5Y Trend) ⓘ | -6.92% | 0.74% |
| FCF Growth (5Y CAGR) ⓘ | 2.27% | 10.79% |
| DPS Growth (5Y CAGR) ⓘ | 11.10% | 9.41% |
Quality (Business durability) | ||
| ROIC (Latest) ⓘ | 8.46% | 10.75% |
| ROA (Latest) ⓘ | 7.09% | 5.41% |
| ROIC (5Y Median) ⓘ | 10.94% | 9.37% |
| ROA (5Y Median) ⓘ | 8.02% | 4.95% |
| Net Debt / EBIT (Latest) ⓘ | -2.31 | 2.04 |
| Net Debt / EBIT (5Y Median) ⓘ | -2.68 | 2.27 |
| Net Debt / EBITDA (Latest) ⓘ | -1.67 | 1.39 |
| Net Debt / Assets ⓘ | -19.70% | 19.27% |
| EBITDA / Interest ⓘ | N/A | 9.58 |
| Operating Margin (Latest) ⓘ | 19.90% | 10.49% |
| Operating Margin (5Y Median) ⓘ | 21.73% | 10.30% |
| Debt to Equity (Latest) ⓘ | 1.84% | 64.82% |
| Profit Margin (Latest) ⓘ | 16.70% | 6.67% |
| Free Cash Flow (Latest) ⓘ | $344.50M | |
Momentum (Price trend) | ||
| 3Y Return ⓘ | -17.32% | +67.77% |
| 12M Return (excl. last month) ⓘ | -18.05% | +12.05% |
| 6M Return ⓘ | -2.53% | 0.00% |
| Price vs. 200-Day MA ⓘ | +6.21% | +0.67% |
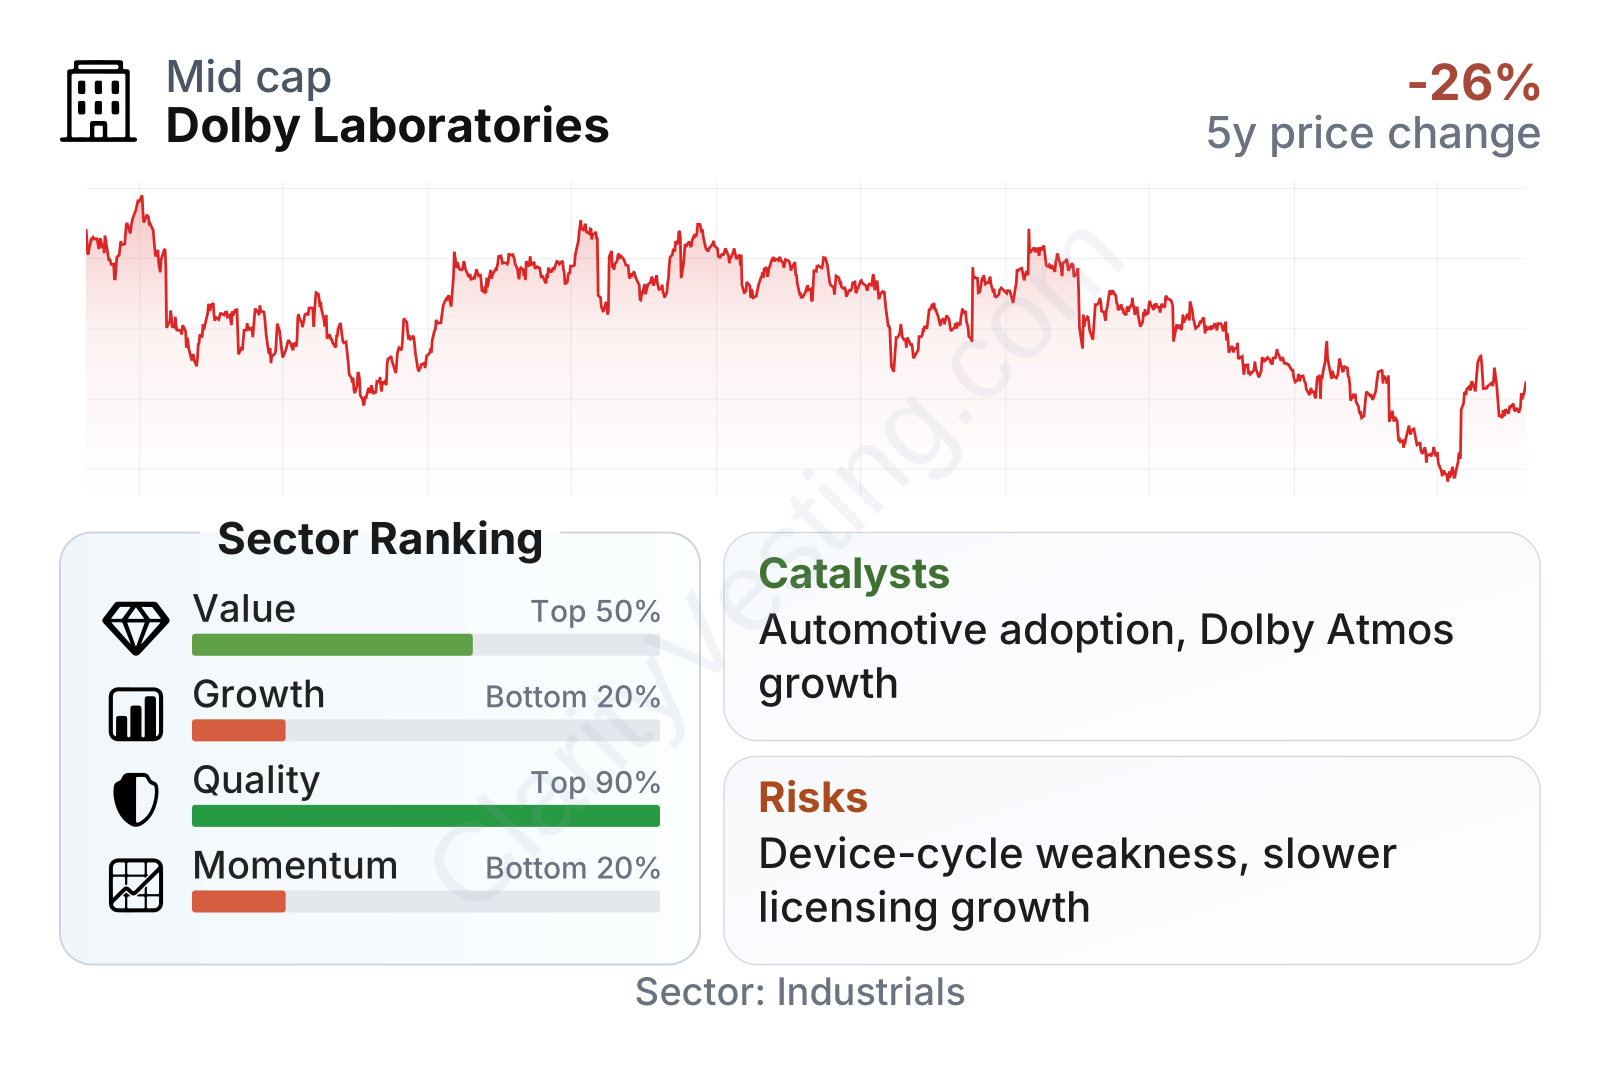
Dolby is a mid-sized company with a relatively low share-price volatility profile, as shown by a beta below 1. Financially, the most striking features are quality and balance-sheet strength rather than fast expansion. Profitability metrics remain well above typical sector levels, free cash flow generation is solid, and leverage is extremely low. On the other hand, growth and price momentum have been weak versus the broader sector, which helps explain why the stock has trended down over the last few years despite continued profitability.
Growth
Dolby operates in markets that still have room to expand over the long run. The broad direction of travel in entertainment and media remains favorable: more premium streaming, more immersive audio, more high-end displays, more gaming content, and more software-defined cars. In each of these areas, content creators and device makers are looking for differentiated experiences, and Dolby’s technology is designed exactly for that purpose.
The company’s strategy also makes sense for future growth because it is not tied to one single device cycle. Dolby participates across several layers of the ecosystem: content production tools, distribution platforms, playback devices, cinemas, and now vehicles. That broad placement reduces dependence on any one customer or hardware category, even though consumer electronics still matter a lot.
Near-term growth has been uneven rather than consistently strong. Quarterly revenue growth has moved between declines and rebounds, which is common for a royalty-based business exposed to shipment cycles in TVs, smartphones, and other devices. The latest year-over-year reading is slightly negative, and the company’s recent growth profile sits below the sector median. That does not invalidate the business model, but it does suggest that Dolby currently looks more like a steady compounder of cash flows than a rapid growth company.
Free cash flow has historically been a major strength, although the most recent trailing period shows a noticeable step down from prior peaks. Even with that decline, cash generation remains meaningful for a company of this size, supporting dividends, buybacks, and ongoing technology investment without placing pressure on the balance sheet.
A visible catalyst is Dolby’s push into automotive. Car interiors are becoming digital entertainment environments, and automakers are increasingly using premium audio and display systems as selling points. Dolby Atmos and Dolby Vision can fit naturally into that trend. Another catalyst is the ongoing expansion of premium streaming and creator workflows, where Dolby formats can become more deeply embedded from production to playback.
Recent company communications have also highlighted continued ecosystem expansion across TVs, mobile devices, PCs, and vehicles, as well as partnerships and content availability around Dolby Atmos and Dolby Vision. None of this guarantees a sudden acceleration, but it supports the case that Dolby still has multiple pathways for gradual adoption growth.
Risks
This article is for informational purposes only and does not constitute financial advice. Some content is AI-generated. See Disclaimer


