Stock Analysis · Dollar General Corporation (DG)
Overview
Dollar General Corporation is a large U.S. discount retailer focused on small-box stores, mostly in rural towns, small communities, and suburban neighborhoods. Its model is straightforward: offer low prices, convenient locations, and a limited but practical mix of everyday products. The chain serves customers looking for quick trips and value on household basics, food, cleaning products, health items, seasonal goods, and low-cost discretionary merchandise.
The company generates essentially all of its revenue from retail sales in the United States through its Dollar General stores and its pOpshelf banner. Based on company disclosures, revenue is heavily concentrated in consumable goods, with the rest coming from seasonal, home, apparel, and basic merchandise categories.
- Consumables: about 82% of net sales. This category includes packaged food, snacks, beverages, paper and cleaning products, over-the-counter medicines, pet supplies, tobacco products, and similar everyday essentials.
- Seasonal: about 9% of net sales. This includes holiday items, toys, batteries, gardening products, and limited-time merchandise tied to seasons and events.
- Home products: about 6% of net sales. This covers kitchen supplies, home décor, small domestic needs, and related household goods.
- Apparel: about 3% of net sales. This mostly includes basic clothing, shoes, and accessories at low price points.
That mix matters because it makes Dollar General more defensive than many retailers: a large majority of sales comes from recurring needs rather than optional purchases. At the same time, the business has been under pressure from a lower-margin mix and higher operating costs, which helps explain why sales have continued rising while profitability has been more volatile.
Over the last five fiscal years, revenue expanded from roughly $34 billion to more than $42 billion, while net income fell from earlier peaks before partially recovering. Gross profit has grown, but selling and administrative costs also climbed meaningfully, showing that scale alone has not fully translated into stronger earnings.
The long-term pattern is clear: Dollar General is still getting bigger, but a larger share of each sales dollar has recently been absorbed by operating expenses. That makes execution, store productivity, and cost control especially important going forward.
Key Figures
| Metric | Value | Sector ⓘ |
|---|---|---|
| Date | Oct 17, 2026 | |
| Context | ||
| Sector | Consumer Defensive | |
| Industry | Discount Stores | |
| Market Cap ⓘ | $27.92B | |
| Beta ⓘ | 0.23 | |
Value (Cheapness) | ||
| P/E Ratio ⓘ | 16.43 | 17.88 |
| P/B Ratio ⓘ | 2.98 | 1.29 |
| FCF Yield ⓘ | 9.68% | 12.39% |
| Dividend Yield ⓘ | 1.85% | 2.85% |
| EBIT / EV ⓘ | 5.96% | 6.43% |
| PEG ⓘ | 1.60 | |
Growth (Business expansion) | ||
| Revenue Growth ⓘ | 5.20% | 4.10% |
| RPS Growth (5Y CAGR) ⓘ | 7.46% | 6.18% |
| EPS Growth (5Y CAGR) ⓘ | -23.27% | -13.59% |
| BVPS Growth (5Y CAGR) ⓘ | 9.77% | 3.20% |
| Margin Growth (5Y Trend) ⓘ | -4.27% | -0.15% |
| FCF Growth (5Y CAGR) ⓘ | 7.45% | 4.10% |
| DPS Growth (5Y CAGR) ⓘ | 9.06% | 6.79% |
Quality (Business durability) | ||
| ROIC (Latest) ⓘ | 13.82% | 12.34% |
| ROA (Latest) ⓘ | 5.33% | 6.30% |
| ROIC (5Y Median) ⓘ | 14.58% | 10.49% |
| ROA (5Y Median) ⓘ | 5.55% | 5.44% |
| Net Debt / EBIT (Latest) ⓘ | 5.77 | 1.96 |
| Net Debt / EBIT (5Y Median) ⓘ | 6.64 | 2.35 |
| Net Debt / EBITDA (Latest) ⓘ | 3.99 | 1.38 |
| Net Debt / Assets ⓘ | 43.59% | 21.51% |
| EBITDA / Interest ⓘ | 17.73 | 9.46 |
| Operating Margin (Latest) ⓘ | 5.57% | 8.87% |
| Operating Margin (5Y Median) ⓘ | 6.32% | 9.53% |
| Debt to Equity (Latest) ⓘ | 168.08% | 72.35% |
| Profit Margin (Latest) ⓘ | 3.90% | 5.40% |
| Free Cash Flow (Latest) ⓘ | $2.70B | |
Momentum (Price trend) | ||
| 3Y Return ⓘ | +19.88% | +20.92% |
| 12M Return (excl. last month) ⓘ | +21.75% | +2.13% |
| 6M Return ⓘ | +5.87% | +1.26% |
| Price vs. 200-Day MA ⓘ | -0.13% | +1.39% |
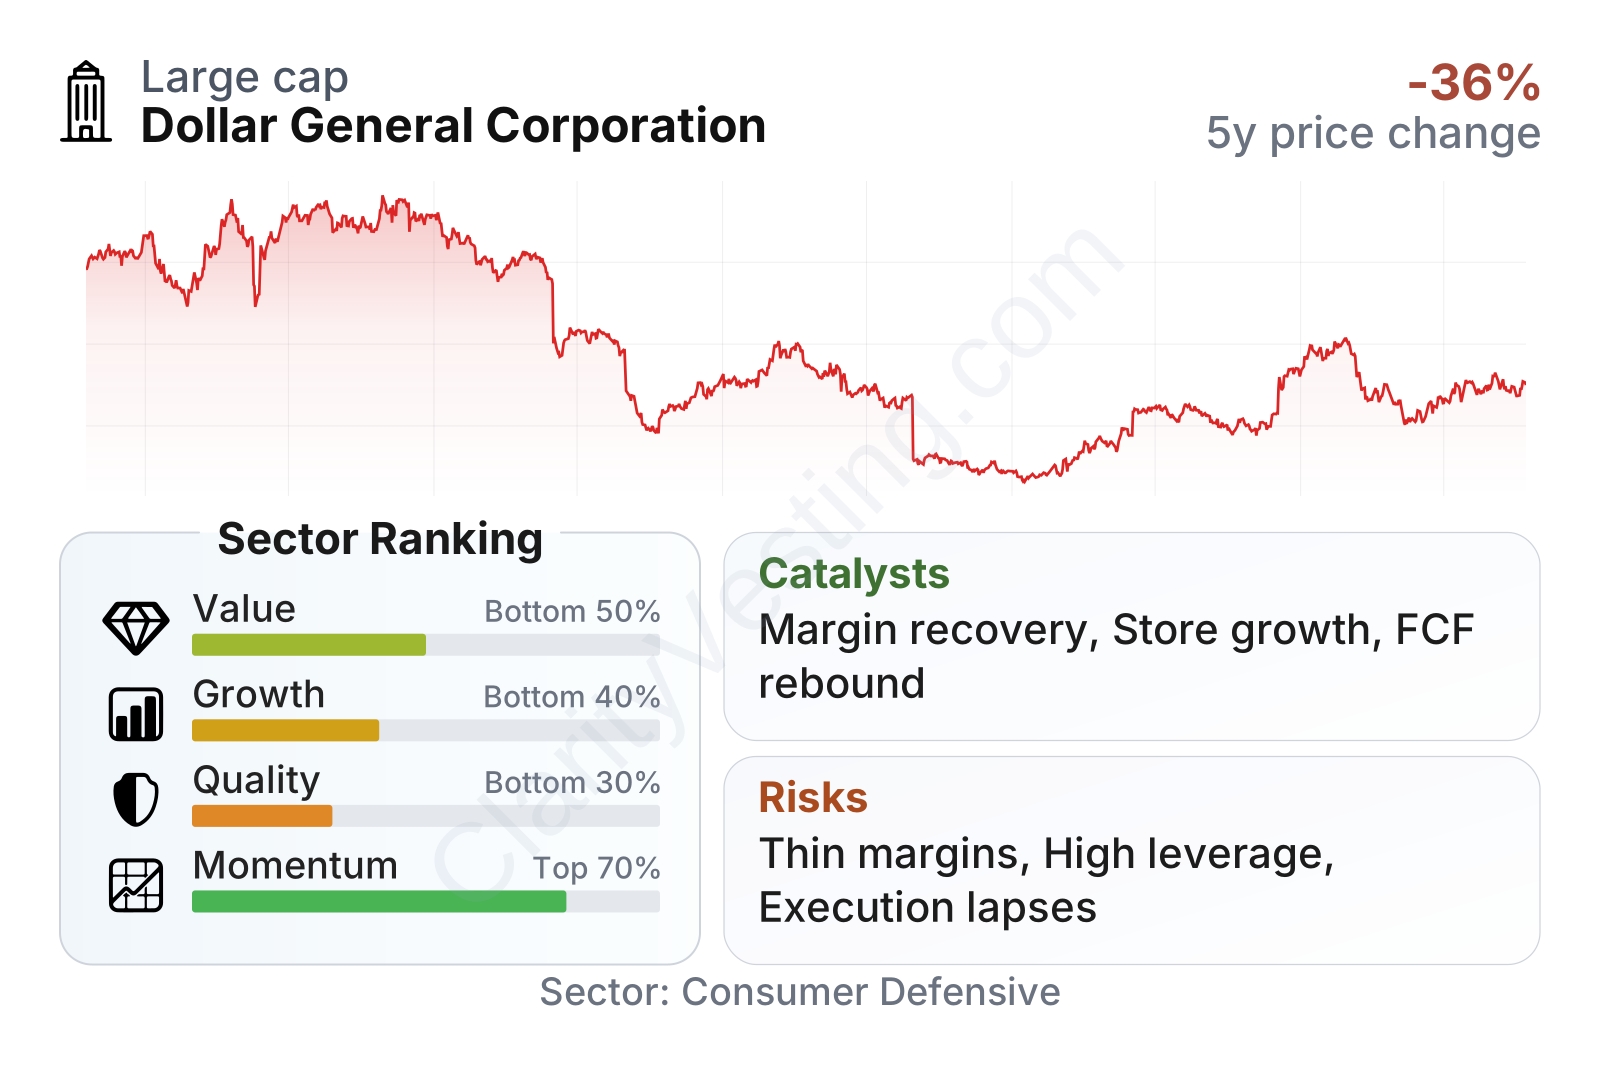
Dollar General remains a large retailer with relatively low share-price volatility, as shown by its beta well below 1. In the broader consumer defensive group, its recent profile looks mixed. Revenue and cash generation have improved, and market momentum has been better than the sector median over several periods. However, the company ranks weaker on quality and growth measures because margins have compressed, earnings per share have declined over five years, and leverage remains above typical sector levels.
The stock’s valuation metrics also send a balanced message rather than a simple cheap-or-expensive signal. Its earnings multiple sits somewhat below the sector median, but book value and cash flow measures are less clearly attractive. In other words, the market appears to be recognizing both the resilience of the business model and the operational issues that have reduced profitability.
Growth
Dollar General operates in a sector that tends to stay relevant across economic cycles. Discount retail benefits when households look for lower prices, quick shopping trips, and nearby stores. That does not make the industry fast-growing in the way technology sectors can be, but it can support steady expansion, especially for operators with room to add stores and improve local convenience.
The company’s strategy still has a logical growth foundation. Dollar General’s core strengths are store proximity, small-box economics, and a product mix centered on everyday necessities. Management has continued investing in new stores, remodels, supply chain capacity, and format experimentation such as pOpshelf and stores with expanded fresh offerings. The company has also emphasized private brands and efforts to improve in-stock positions, both of which can support traffic and basket size over time.
Recent revenue growth has been positive and fairly consistent after a more uneven period. The latest annual pace is around 5%, slightly above the sector median, and the five-year revenue-per-share trend has also been better than the median. This suggests the business is still expanding even though profit conversion has been less impressive.
Cash generation has improved materially from the low point seen a few years ago. Free cash flow moved from a relatively weak level back into a much stronger range, helped by better operating performance and working-capital dynamics. That improvement matters because it gives the company more flexibility for store investment, debt management, and shareholder returns without needing aggressive external financing.
A meaningful catalyst in the current setup is execution recovery rather than a dramatic new business line. If Dollar General can improve store standards, inventory flow, shrink control, and labor productivity while keeping sales growth in the low-to-mid single digits, earnings can rebound faster than revenue. Recent company updates have also highlighted store portfolio optimization, supply chain investments, and leadership actions aimed at stabilizing operations. Those are practical levers in a mature retail model, and they can have a real effect if carried out consistently.
Risks
This article is for informational purposes only and does not constitute financial advice. Some content is AI-generated. See Disclaimer


