Stock Analysis · Deterra Royalties Limited (DETRF)
Overview
Deterra Royalties Limited is an Australian royalty company. Instead of operating mines itself, it owns contractual rights that allow it to receive a share of revenue from mines and related infrastructure. That business model is simple to understand: when the underlying mine ships ore or generates eligible sales, Deterra collects royalty income. Because it does not run the mine, its operating costs are usually far lower than those of traditional mining companies.
The company’s economic base is still dominated by iron ore royalties tied to BHP’s Mining Area C operations in Western Australia. Over time, Deterra has also added exposure to other commodities and development-stage assets through acquisitions and investments, including battery-material and energy-transition related royalties. That broader portfolio matters because it reduces dependence on a single asset, even though the business remains concentrated today.
Main sources of revenue are approximately:
- Mining Area C royalty: about 85% to 95% of group revenue in recent years. This is the key royalty over BHP’s large Pilbara iron ore hub and is the company’s main cash generator.
- Other royalties and related income: roughly 5% to 15%. This includes smaller producing royalties, infrastructure-linked income, and contributions from newer portfolio assets.
- Development-stage and optionality assets: currently a minimal direct revenue contribution, but these assets are intended to support future diversification if projects move into production.
The financial structure is one of the main attractions here. Revenue converts into profit and cash flow at unusually high rates because the company has very limited direct operating costs. Over the last several fiscal years, revenue has stayed in a fairly narrow band, while margins remained exceptionally high. That makes Deterra look less like a miner and more like an asset owner collecting fees from long-life, low-cost operations.
The business has shown a rare pattern: revenue moved between roughly the low-$200 million and mid-$260 million range over the past five years, yet operating income and net income remained very strong throughout. Costs stayed very low relative to sales, which helps explain why profitability is far above the sector norm.
Key Figures
| Metric | Value | Sector ⓘ |
|---|---|---|
| Date | Oct 03, 2026 | |
| Context | ||
| Sector | Basic Materials | |
| Industry | Other Industrial Metals & Mining | |
| Market Cap ⓘ | $1.57B | |
| Beta ⓘ | 0.55 | |
Value (Cheapness) | ||
| P/E Ratio ⓘ | 13.41 | 17.61 |
| P/B Ratio ⓘ | 10.98 | 1.77 |
| FCF Yield ⓘ | 19.39% | 5.87% |
| Dividend Yield ⓘ | 7.86% | 2.06% |
| EBIT / EV ⓘ | N/A | 6.43% |
| PEG ⓘ | N/A | |
Growth (Business expansion) | ||
| Revenue Growth ⓘ | -19.90% | 11.30% |
| RPS Growth (5Y CAGR) ⓘ | -2.31% | 4.46% |
| EPS Growth (5Y CAGR) ⓘ | 148.90% | -13.11% |
| BVPS Growth (5Y CAGR) ⓘ | 4.61% | 5.51% |
| Margin Growth (5Y Trend) ⓘ | -3.16% | -1.57% |
| FCF Growth (5Y CAGR) ⓘ | N/A | 0.55% |
| DPS Growth (5Y CAGR) ⓘ | 1.95% | 6.02% |
Quality (Business durability) | ||
| ROIC (Latest) ⓘ | N/A | 9.31% |
| ROA (Latest) ⓘ | 68.79% | 4.94% |
| ROIC (5Y Median) ⓘ | 106.92% | 7.91% |
| ROA (5Y Median) ⓘ | 114.73% | 3.93% |
| Net Debt / EBIT (Latest) ⓘ | 0.31 | 1.40 |
| Net Debt / EBIT (5Y Median) ⓘ | 0.24 | 1.70 |
| Net Debt / EBITDA (Latest) ⓘ | 0.30 | 0.91 |
| Net Debt / Assets ⓘ | 36.50% | 13.69% |
| EBITDA / Interest ⓘ | 18.14 | 11.93 |
| Operating Margin (Latest) ⓘ | 85.18% | 13.07% |
| Operating Margin (5Y Median) ⓘ | 93.61% | 11.86% |
| Debt to Equity (Latest) ⓘ | 100.45% | 40.43% |
| Profit Margin (Latest) ⓘ | 67.74% | 6.57% |
| Free Cash Flow (Latest) ⓘ | $304.24M | |
Momentum (Price trend) | ||
| 3Y Return ⓘ | +34.21% | +65.06% |
| 12M Return (excl. last month) ⓘ | +16.20% | +36.05% |
| 6M Return ⓘ | +10.72% | +1.89% |
| Price vs. 200-Day MA ⓘ | +4.59% | +1.03% |
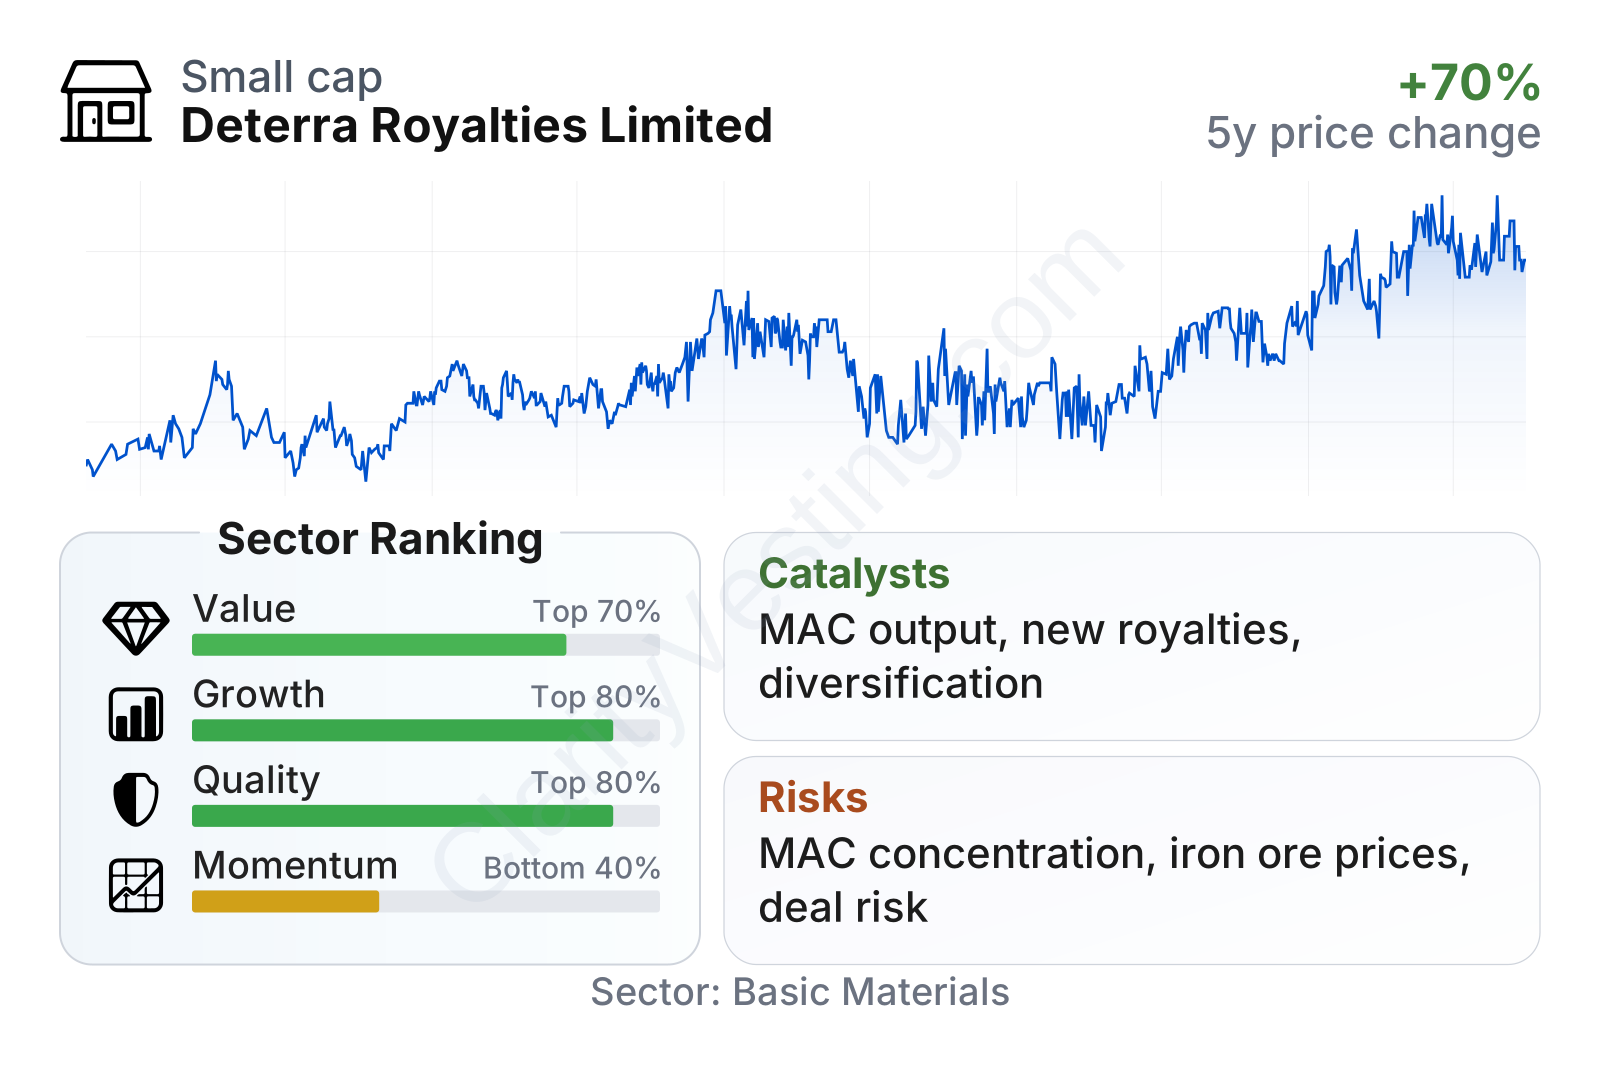
The market signals are mixed but generally coherent with the business model. The shares have trended upward over the last several years, although the path has not been as strong as many basic materials names over a full three-year period. On valuation, earnings-based multiples are not stretched versus the sector median, while cash generation and dividend yield stand out positively. The main item that looks expensive is price-to-book, but that ratio is less useful for a royalty company because accounting book value often understates the worth of long-life contractual cash flows.
Quality metrics are the clearest strength. Profit margin, operating margin, return on assets, and long-term returns on invested capital are all far above sector norms. Leverage is present, but debt relative to earnings remains moderate and interest coverage is still solid. Growth indicators are less convincing: recent revenue growth has been negative year over year, and five-year revenue per share has been soft, even though earnings per share growth over five years remains strong.
Growth
Deterra sits in a part of the market with durable long-term relevance. Iron ore remains essential for steelmaking, and the Pilbara is one of the world’s most competitive iron ore regions. On top of that, the royalty model itself can scale well because once a royalty is acquired, production growth at the underlying asset can lift Deterra’s revenue without requiring the company to build or operate the project.
The company’s strategy also makes sense in a longer-term context. Management has been trying to use the cash flow from Mining Area C to build a broader royalty portfolio across mining and adjacent resource infrastructure. That is important because the biggest strategic issue for Deterra is concentration. If diversification works, the company could gradually shift from being viewed as a single-asset royalty vehicle toward a broader natural-resources royalty platform.
A major catalyst is any expansion in output or mine life at Mining Area C and nearby associated operations. Since this asset is operated by a very large, financially strong mining group, Deterra benefits from the possibility of sustained production over many years without bearing operating responsibility itself. Another catalyst is the development of acquired royalties linked to future-facing materials, especially if those projects move from exploration or development into commercial production.
Recent company updates have continued to emphasize portfolio expansion and capital allocation into additional royalty opportunities. The broad opportunity is clear: a business already generating strong free cash flow can reinvest into new royalties, which may create a compounding effect if acquisitions are disciplined and if underlying projects progress as expected.
Risks
This article is for informational purposes only and does not constitute financial advice. Some content is AI-generated. See Disclaimer


