Stock Analysis · Diversified Energy Company plc (DEC)
Overview
Diversified Energy Company plc is a U.S.-focused natural gas and oil producer that specializes in buying mature, long-life wells and operating them for cash generation rather than rapid production growth. Its assets are concentrated in established producing regions, especially Appalachia and, through more recent expansion, other U.S. basins. The company’s model is different from many exploration-heavy peers: it targets older producing properties, applies cost control and operational efficiency, and aims to turn low-decline production into steady free cash flow.
Revenue comes primarily from selling produced hydrocarbons and from activities connected to those assets. Based on the company’s reporting and business mix, the main sources are broadly the following:
- Natural gas sales: approximately 50% to 65% of revenue in a typical year, depending on commodity prices and hedge settlements. This is the largest exposure and reflects the company’s strong gas weighting.
- Oil sales: approximately 15% to 25% of revenue. This includes crude output from acquired properties and can vary meaningfully with oil prices.
- Natural gas liquids sales: approximately 10% to 20% of revenue. This includes products such as propane, butane, and related liquids tied to gas production.
- Other operating and marketing-related revenue: usually a small share, often below 10%. This can include midstream-related, transportation, or miscellaneous field-related income depending on the reporting period.
- Derivative and hedging impacts: these can materially affect reported revenue and earnings from one year to another, although they are better understood as risk-management outcomes than as core product demand.
The business is therefore less about discovering new fields and more about managing decline, controlling operating costs, and locking in commodity prices through hedging. For long-term analysis, that makes cash generation and balance sheet discipline more important than simple production growth.
The multi-year profit flow shows how uneven reported results can be in this business. Revenue and gross profit have fluctuated sharply with commodity prices, acquisition activity, and non-cash items, while interest expense has become a meaningful recurring claim on earnings. The most encouraging point is that the business has shown an ability to generate substantial operating profit and cash flow in stronger periods, but the path is not smooth.
Key Figures
| Metric | Value | Sector ⓘ |
|---|---|---|
| Date | Oct 17, 2026 | |
| Context | ||
| Sector | Energy | |
| Industry | Oil & Gas Integrated | |
| Market Cap ⓘ | $1.01B | |
| Beta ⓘ | 0.35 | |
Value (Cheapness) | ||
| P/E Ratio ⓘ | 2.39 | 15.44 |
| P/B Ratio ⓘ | 1.17 | 1.73 |
| FCF Yield ⓘ | 45.73% | 8.20% |
| Dividend Yield ⓘ | 7.81% | 3.59% |
| EBIT / EV ⓘ | 35.41% | 7.46% |
| PEG ⓘ | N/A | |
Growth (Business expansion) | ||
| Revenue Growth ⓘ | 24.70% | 26.90% |
| RPS Growth (5Y CAGR) ⓘ | -3.18% | 6.90% |
| EPS Growth (5Y CAGR) ⓘ | N/A | -15.73% |
| BVPS Growth (5Y CAGR) ⓘ | -5.40% | 6.07% |
| Margin Growth (5Y Trend) ⓘ | N/A | 0.58% |
| FCF Growth (5Y CAGR) ⓘ | 0.91% | 1.86% |
| DPS Growth (5Y CAGR) ⓘ | -23.21% | 16.79% |
Quality (Business durability) | ||
| ROIC (Latest) ⓘ | 36.11% | 11.40% |
| ROA (Latest) ⓘ | 16.40% | 6.06% |
| ROIC (5Y Median) ⓘ | N/A | 10.30% |
| ROA (5Y Median) ⓘ | -2.36% | 5.42% |
| Net Debt / EBIT (Latest) ⓘ | 2.12 | 1.64 |
| Net Debt / EBIT (5Y Median) ⓘ | N/A | 1.83 |
| Net Debt / EBITDA (Latest) ⓘ | 1.39 | 1.08 |
| Net Debt / Assets ⓘ | 48.35% | 17.29% |
| EBITDA / Interest ⓘ | 2.68 | 9.64 |
| Operating Margin (Latest) ⓘ | 42.28% | 16.27% |
| Operating Margin (5Y Median) ⓘ | -10.86% | 20.39% |
| Debt to Equity (Latest) ⓘ | 311.57% | 54.76% |
| Profit Margin (Latest) ⓘ | 23.31% | 8.82% |
| Free Cash Flow (Latest) ⓘ | $463.19M | |
Momentum (Price trend) | ||
| 3Y Return ⓘ | +11.31% | +67.38% |
| 12M Return (excl. last month) ⓘ | +5.37% | +49.19% |
| 6M Return ⓘ | -3.26% | +7.07% |
| Price vs. 200-Day MA ⓘ | +5.07% | +9.56% |
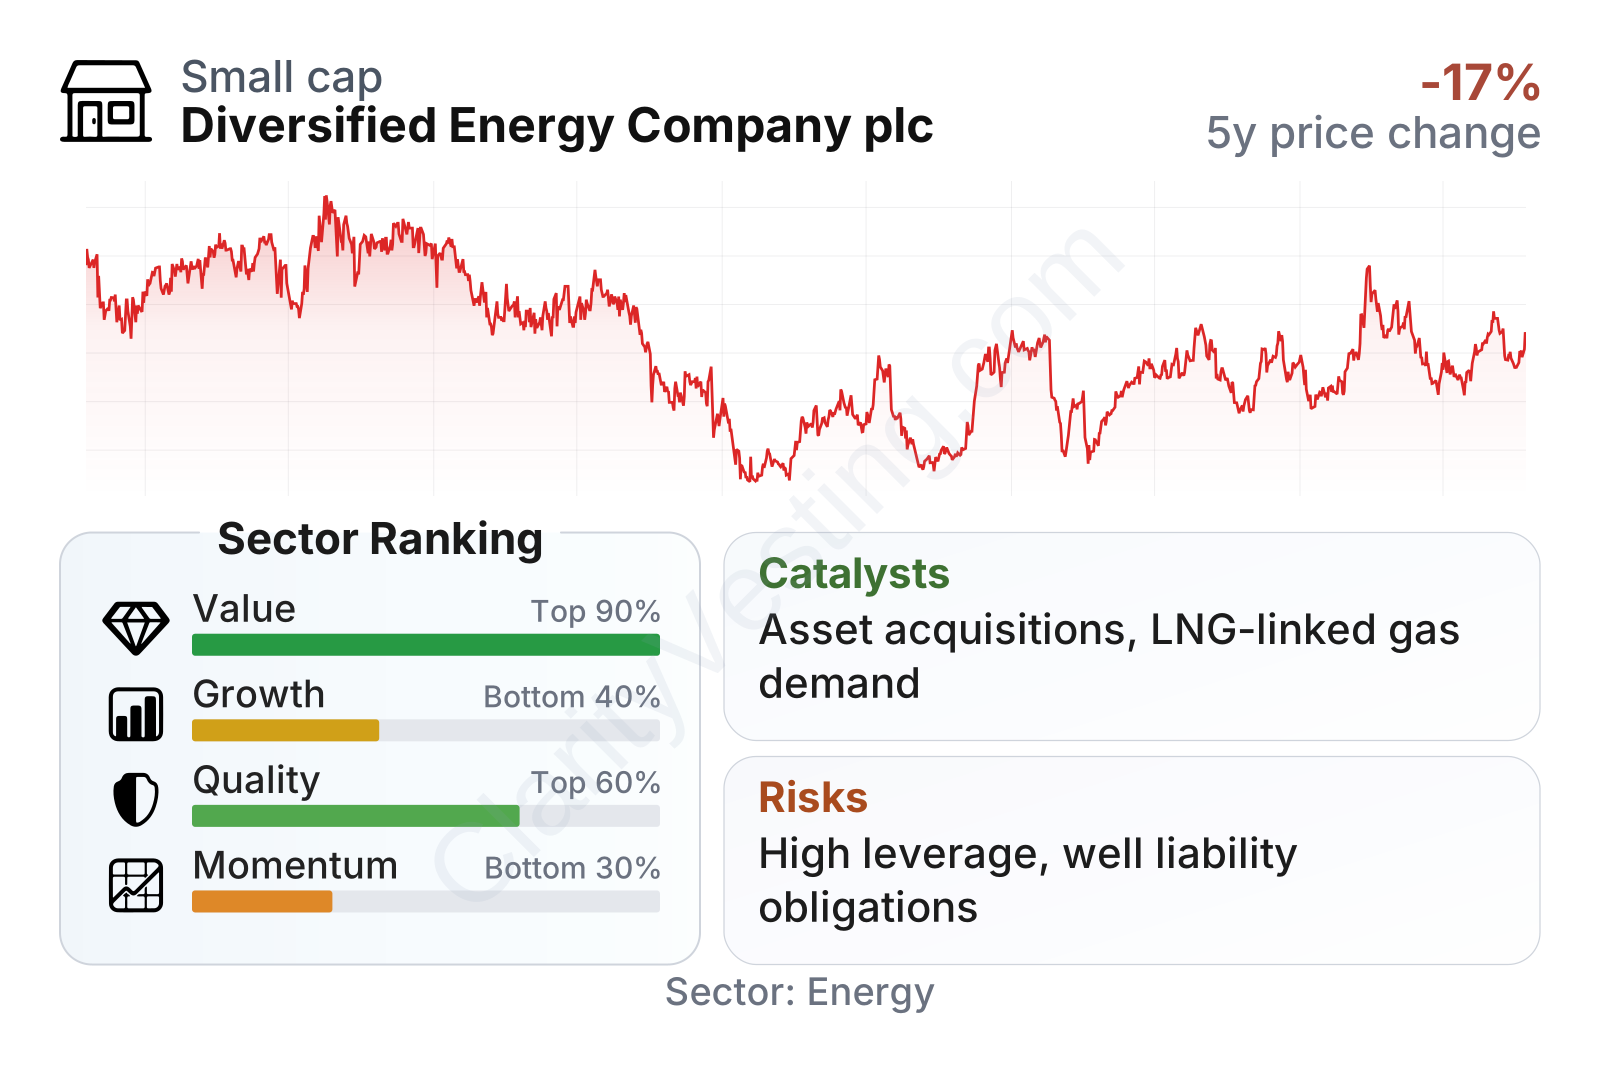
Diversified Energy currently screens as very inexpensive on headline valuation measures relative to much of the energy sector. Earnings, free cash flow yield, and dividend yield all stand out, and recent profitability is stronger than many peers on margins and returns on capital. At the same time, the table also shows why the market is cautious: growth ranks weakly versus the sector, leverage is elevated, and stock performance has trailed energy peers over one-, three-, and recent six-month periods.
The stock’s beta is low, which suggests lower sensitivity to broad market moves than many energy names. However, that should not be confused with low business risk. In this case, the central debate is not market volatility but whether current cash generation can remain durable after accounting for asset decline, financing costs, and commodity-price swings.
Growth
Diversified Energy operates in a sector that is mature rather than high growth. U.S. natural gas demand still has structural support from electricity generation, industrial use, LNG export growth, and the continued role of gas as a balancing fuel for intermittent renewables. That backdrop is helpful, but it does not automatically turn the company into a growth business in the conventional sense.
Its strategy makes sense if judged on cash efficiency rather than volume expansion. The company buys producing assets that larger operators may no longer consider core, then seeks to extend their economic life through lower-cost operations, field optimization, and hedging. When executed well, that can create attractive returns because acquisition prices for mature wells are often lower than the cost and risk of drilling new ones. It is a model built around harvesting value from overlooked assets.
A meaningful catalyst is the continued need for consolidation in U.S. upstream energy. Many larger producers focus on premium drilling inventory and may continue to sell mature properties, giving Diversified a steady opportunity set. Another catalyst is any period of stronger natural gas pricing, especially if supported by LNG export capacity growth and improving domestic demand. In that environment, the company’s existing production base can produce more cash without requiring the same level of development spending as a growth-focused driller.
Recent company updates have also highlighted activity around acquisitions, financing, and asset management initiatives intended to support scale and improve operating efficiency. For a business like this, the most important “growth” signal is not fast revenue expansion every year, but whether acquired assets continue to support free cash flow after maintenance needs, plugging obligations, and interest costs.
Risks
This article is for informational purposes only and does not constitute financial advice. Some content is AI-generated. See Disclaimer


