Stock Analysis · Dupont De Nemours Inc (DD)
Overview
DuPont de Nemours is a specialty materials company that sells engineered products used in electronics, water filtration, industrial production, healthcare, construction, and worker safety. In simple terms, it makes high-performance materials and components that often sit deep inside customers’ products rather than being visible consumer brands. Its business is tied to long industrial cycles, but many of its end markets are supported by structural themes such as semiconductor manufacturing, electrification, clean water, and advanced medical devices.
After several years of portfolio reshaping, DuPont is more focused than the older, broader chemical company many people remember. The current group is centered on advanced materials and industrial technologies, with a growing emphasis on electronics and healthcare-related applications. That matters for long-term analysis because these categories tend to offer better pricing power and higher technical barriers than commodity chemicals.
Based on the company’s segment reporting in recent annual filings, revenue is mainly generated from the following activities:
- Electronics & Industrial: approximately 55% to 60% of revenue. This includes semiconductor materials, interconnect solutions, advanced packaging materials, industrial polymers, and other products used in electronics manufacturing and industrial applications.
- Water & Protection: approximately 40% to 45% of revenue. This includes water filtration and separation technologies, worker safety products, shelter and building materials, and related protective solutions.
Within those broad segments, semiconductor-related materials and water technologies are especially important because they connect DuPont to markets where performance, reliability, and customer qualification processes can create durable business relationships.
Profitability has been uneven in recent years. Revenue recovered modestly in 2024 after a weaker 2023, while margins remained below earlier levels. The business still produces meaningful cash flow, but earnings have been affected by restructuring, portfolio moves, and softer demand in some industrial lines.
The multi-year profit flow shows a company that kept gross profit relatively resilient through 2024 even as revenue moved around, but bottom-line earnings became much more volatile. That points to a business where core operations still have value, yet reported net income can swing sharply because of charges, portfolio actions, and cost absorption.
Key Figures
| Metric | Value | Sector ⓘ |
|---|---|---|
| Date | Oct 24, 2026 | |
| Context | ||
| Sector | Basic Materials | |
| Industry | Specialty Chemicals | |
| Market Cap ⓘ | $17.96B | |
| Beta ⓘ | 1.08 | |
Value (Cheapness) | ||
| P/E Ratio ⓘ | 35.74 | 16.92 |
| P/B Ratio ⓘ | 1.35 | 1.66 |
| FCF Yield ⓘ | 6.28% | 5.83% |
| Dividend Yield ⓘ | 2.34% | 2.07% |
| EBIT / EV ⓘ | 4.08% | 6.38% |
| PEG ⓘ | 0.78 | |
Growth (Business expansion) | ||
| Revenue Growth ⓘ | 4.00% | 11.25% |
| RPS Growth (5Y CAGR) ⓘ | -8.28% | 4.49% |
| EPS Growth (5Y CAGR) ⓘ | -24.71% | -15.24% |
| BVPS Growth (5Y CAGR) ⓘ | -8.84% | 5.49% |
| Margin Growth (5Y Trend) ⓘ | -8.18% | -1.54% |
| FCF Growth (5Y CAGR) ⓘ | N/A | 0.37% |
| DPS Growth (5Y CAGR) ⓘ | 5.32% | 5.91% |
Quality (Business durability) | ||
| ROIC (Latest) ⓘ | 3.23% | 9.59% |
| ROA (Latest) ⓘ | 0.19% | 4.92% |
| ROIC (5Y Median) ⓘ | 3.25% | 7.91% |
| ROA (5Y Median) ⓘ | 1.87% | 3.92% |
| Net Debt / EBIT (Latest) ⓘ | 1.78 | 1.36 |
| Net Debt / EBIT (5Y Median) ⓘ | 4.69 | 1.69 |
| Net Debt / EBITDA (Latest) ⓘ | 0.92 | 0.93 |
| Net Debt / Assets ⓘ | 6.58% | 13.69% |
| EBITDA / Interest ⓘ | 6.23 | 12.38 |
| Operating Margin (Latest) ⓘ | 9.40% | 13.24% |
| Operating Margin (5Y Median) ⓘ | 12.58% | 11.82% |
| Debt to Equity (Latest) ⓘ | 22.70% | 40.30% |
| Profit Margin (Latest) ⓘ | 0.79% | 6.38% |
| Free Cash Flow (Latest) ⓘ | $1.13B | |
Momentum (Price trend) | ||
| 3Y Return ⓘ | +55.13% | +73.47% |
| 12M Return (excl. last month) ⓘ | +34.72% | +27.59% |
| 6M Return ⓘ | -3.46% | -4.02% |
| Price vs. 200-Day MA ⓘ | -2.31% | -0.65% |
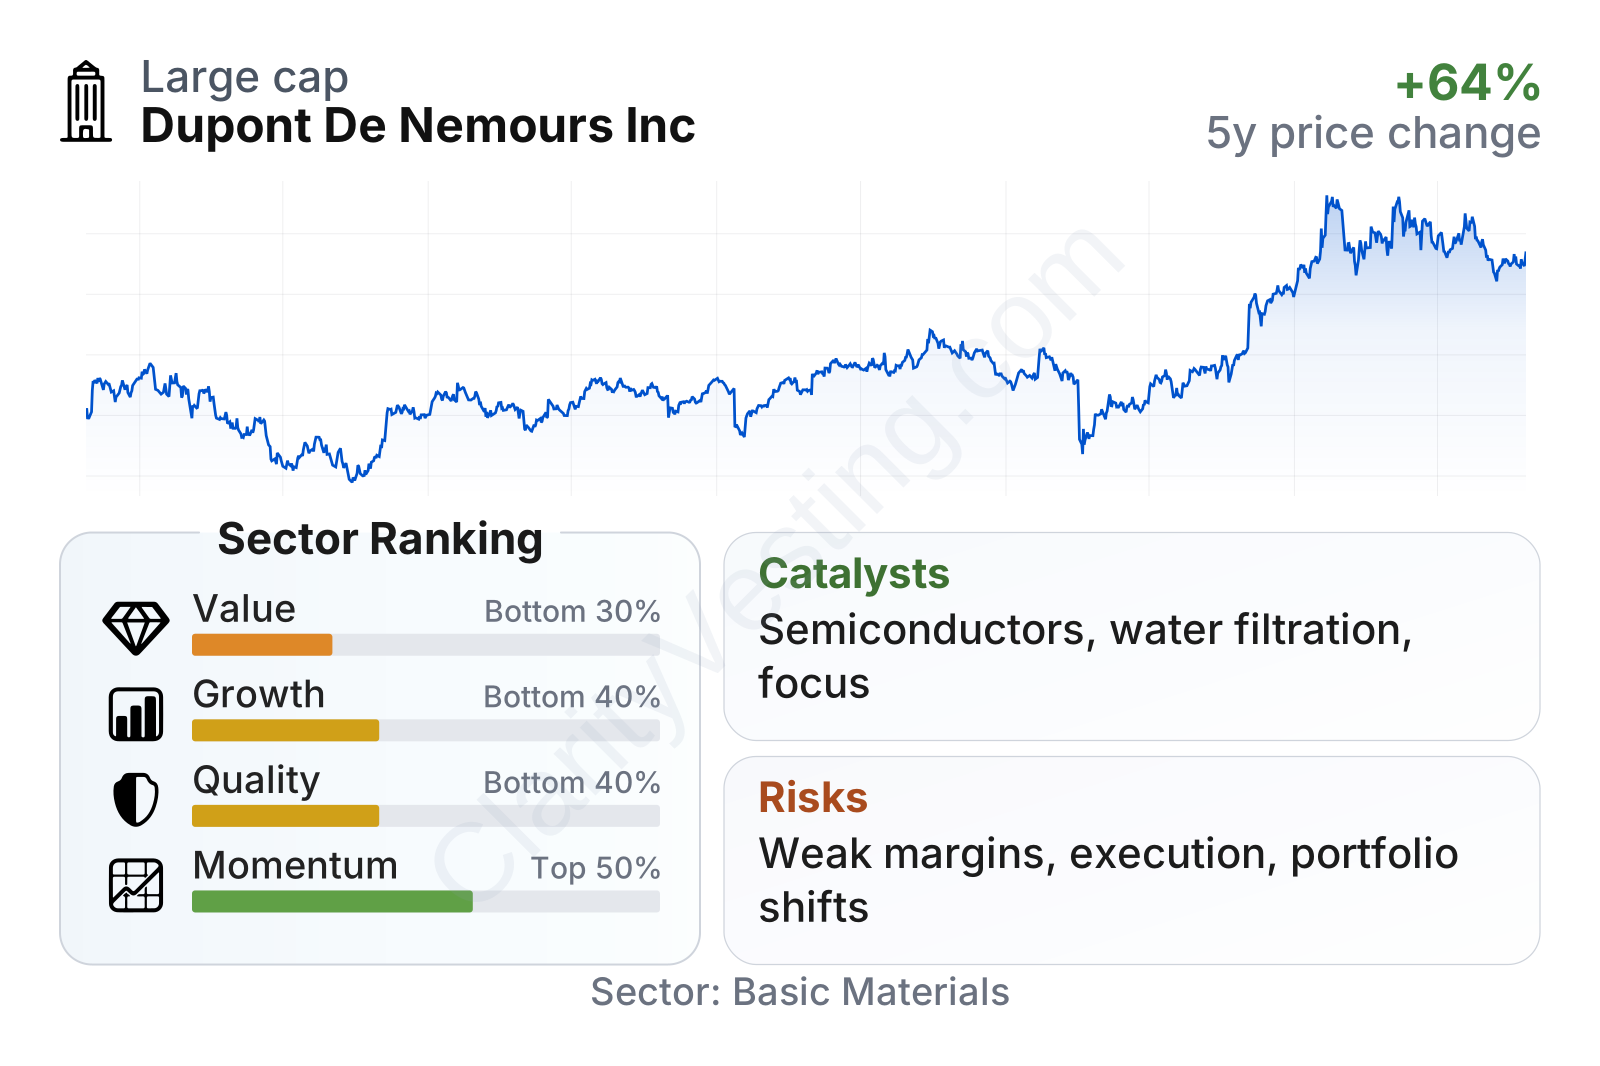
DuPont is a large specialty materials company with moderate share-price volatility. The overall factor profile is mixed: value, quality, and growth all rank in the lower part of the sector, while momentum is around the middle. The most notable contrast is between a still-solid free cash flow profile and weak reported earnings profitability, which helps explain why the P/E ratio looks elevated while cash-based measures appear less stretched.
The stock has also been volatile over the last several years, reflecting both cyclical demand shifts and changing market expectations around the company’s portfolio. The recent price recovery has been much stronger than the long-term growth profile of the underlying business, so market confidence currently seems to rest more on future improvement than on a long record of steady expansion.
Growth
DuPont operates in parts of the materials sector that have real long-term demand drivers. Semiconductor complexity keeps rising, pushing the need for more advanced materials used in fabrication and packaging. Water scarcity and tighter regulation support membrane filtration and purification technologies. Healthcare and medical packaging also tend to benefit from aging populations and quality requirements. So while DuPont is not a fast-growing software-like company, several of its niches are connected to durable secular trends.
The company’s strategy also makes industrial sense. Management has been simplifying the portfolio and putting more attention on businesses with stronger technology content and better margins. That is usually a positive sign in specialty chemicals and advanced materials, where value often comes from formulation know-how, customer qualification, patents, and integration into critical production processes.
Recent revenue growth has been choppy rather than consistently upward. There was a period of contraction through much of 2023, a partial rebound during 2024 and most of 2025, and then a very sharp drop in the latest periods shown. That final decline likely reflects a major portfolio change rather than a normal demand slowdown, which means headline growth needs to be read carefully. For long-term analysis, the more important question is whether the remaining business can grow faster and more profitably after the restructuring.
Cash generation has improved materially from the weak levels seen in 2023 and early 2024. Trailing free cash flow is now back above $1 billion, which is meaningful for a company of this size. That provides financial flexibility for debt management, dividends, restructuring, and selective reinvestment. Stronger cash conversion is one of the clearest signs that the core business is more stable than the headline net margin suggests.
A notable catalyst is DuPont’s increased exposure to electronics materials, especially where products are designed into complex semiconductor production steps. Another is water filtration, a field supported by infrastructure spending, industrial reuse, and tighter water-quality standards. Recent corporate actions and separation plans can also create opportunity if they leave the remaining company more focused, easier to value, and structurally higher margin.
Risks
This article is for informational purposes only and does not constitute financial advice. Some content is AI-generated. See Disclaimer


