Stock Analysis · Digitalbridge Group Inc (DBRG)
Overview
DigitalBridge Group Inc. is an alternative asset manager focused on digital infrastructure. In simple terms, it raises money from large investors such as pension funds, insurance companies, and sovereign wealth funds, then invests that capital into the physical and operating backbone of the internet economy. Its areas of focus include data centers, cell towers, fiber networks, small cells, and related digital infrastructure platforms.
The company has spent the last several years reshaping itself away from a more diversified real estate structure and toward a more specialized asset-management model tied to digital infrastructure. That matters because the business is increasingly built around earning recurring fees on assets it manages, while also retaining stakes in some of the platforms and investments it helps develop.
Based on recent company filings, DigitalBridge’s revenue mix is centered on fee-paying investment management activities, with additional contributions from investment income and other balance-sheet-related items. Exact categories can move from period to period because of the company’s structure and reporting, but the main sources can be summarized as follows:
- Management and advisory fees: the largest source of revenue, generated from managing digital infrastructure funds and vehicles for institutional clients.
- Performance-based earnings and incentive income: earned when investments or funds meet return hurdles and other contractual conditions.
- Investment income from retained interests: includes gains, income, and valuation-related results tied to the company’s own investments in digital infrastructure platforms and funds.
- Other operating income: can include transaction-related items, reimbursements, and smaller recurring or one-time revenue sources.
For a long-term reader, the key point is that DigitalBridge is not a traditional telecom operator or a pure software company. It is mainly a specialist capital allocator in one of the most important infrastructure themes of the modern economy: the assets that carry cloud computing, mobile traffic, and artificial intelligence workloads.
Profitability improved sharply from loss-making levels earlier in the transformation period, although annual revenue has also been uneven as the company simplified its structure and exited non-core operations. The broad pattern is a move toward a lighter, more fee-driven model with lower direct operating intensity than an owner-operator model.
The business has shown a clear shift from restructuring losses toward positive net income and stronger gross profitability, but the revenue line has not moved in a straight path. That combination suggests a company still being re-shaped rather than one already in a fully settled steady-state model.
Key Figures
| Metric | Value | Sector ⓘ |
|---|---|---|
| Date | Oct 03, 2026 | |
| Context | ||
| Sector | Financial Services | |
| Industry | Asset Management | |
| Market Cap ⓘ | $3.00B | |
| Beta ⓘ | 1.48 | |
Value (Cheapness) | ||
| P/E Ratio ⓘ | 10.06 | 12.60 |
| P/B Ratio ⓘ | 1.42 | 1.23 |
| FCF Yield ⓘ | 5.96% | 10.16% |
| Dividend Yield ⓘ | 0.25% | 2.96% |
| EBIT / EV ⓘ | 7.87% | 7.77% |
| PEG ⓘ | 3.06 | |
Growth (Business expansion) | ||
| Revenue Growth ⓘ | 58.90% | 9.50% |
| RPS Growth (5Y CAGR) ⓘ | -2.66% | 12.10% |
| EPS Growth (5Y CAGR) ⓘ | N/A | -9.45% |
| BVPS Growth (5Y CAGR) ⓘ | -7.04% | 5.01% |
| Margin Growth (5Y Trend) ⓘ | -1.85% | -4.07% |
| FCF Growth (5Y CAGR) ⓘ | N/A | 4.96% |
| DPS Growth (5Y CAGR) ⓘ | -11.02% | 8.79% |
Quality (Business durability) | ||
| ROIC (Latest) ⓘ | 16.79% | 9.60% |
| ROE (Latest) ⓘ | 18.94% | 13.84% |
| ROA (Latest) ⓘ | 9.48% | 1.53% |
| ROIC (5Y Median) ⓘ | 0.07% | 7.86% |
| ROE (5Y Median) ⓘ | -8.37% | 12.20% |
| ROA (5Y Median) ⓘ | 1.99% | 1.29% |
| Net Debt / EBIT (Latest) ⓘ | -0.69 | 0.91 |
| Net Debt / EBIT (5Y Median) ⓘ | 0.20 | 0.74 |
| Net Debt / EBITDA (Latest) ⓘ | -0.63 | 0.97 |
| Operating Margin (Latest) ⓘ | 32.15% | 22.12% |
| Operating Margin (5Y Median) ⓘ | 1.98% | 24.39% |
| Debt to Equity (Latest) ⓘ | 13.63% | 60.37% |
| Profit Margin (Latest) ⓘ | 54.34% | 26.62% |
| Free Cash Flow (Latest) ⓘ | $178.69M | |
Momentum (Price trend) | ||
| 3Y Return ⓘ | -8.17% | +89.23% |
| 12M Return (excl. last month) ⓘ | +40.00% | +17.35% |
| 6M Return ⓘ | +4.09% | +10.00% |
| Price vs. 200-Day MA ⓘ | +3.17% | +3.73% |
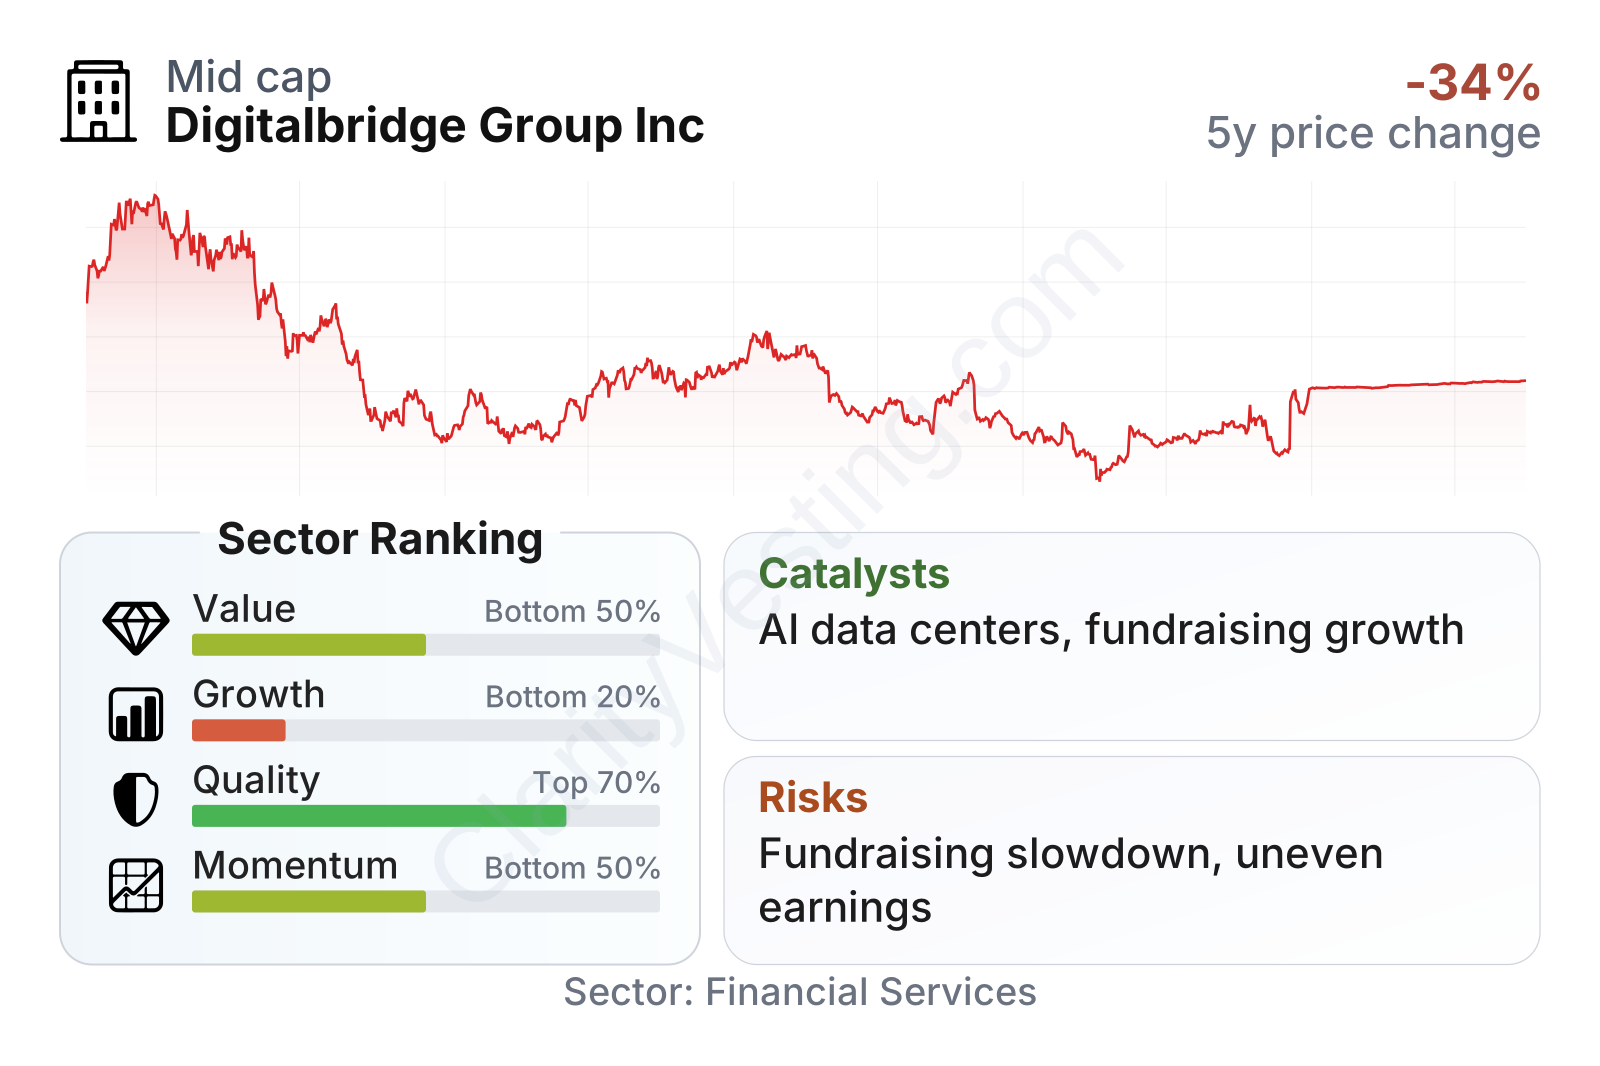
DigitalBridge sits in the mid-cap range and has shown above-average share-price volatility, which fits a company exposed to both capital markets and a specialized infrastructure theme. The factor profile is mixed: recent profitability and balance-sheet quality look solid, but long-term growth metrics remain weak relative to the broader financial sector. Valuation measures are not stretched on earnings, though they are not clearly discounted across every metric either. Recent momentum has improved from the lows, but the longer stock record still reflects a difficult multiyear reset.
The stock history also shows that the market has treated DigitalBridge as a turnaround and transition name rather than a stable compounder. Shares fell heavily from 2021 through early 2025, then recovered meaningfully into 2026. That rebound indicates better sentiment, but it also highlights how sensitive the stock can be to expectations around fundraising, asset values, and execution.
Growth
DigitalBridge operates in a part of the market with strong long-term demand drivers. Data centers, fiber, and wireless infrastructure are benefiting from steady increases in mobile usage, cloud adoption, edge computing, and especially artificial intelligence workloads. These are multiyear forces, and they support the idea that specialized investment firms with relevant expertise can keep finding opportunities to deploy capital.
The company’s strategy also makes sense on paper. Rather than competing directly as a massive owner of all these assets, DigitalBridge aims to be a specialist manager that earns fees from institutional capital while keeping selective ownership exposure. That can be attractive if assets under management expand because fee revenue tends to be more scalable than directly owning and operating every project on the balance sheet.
Recent corporate communications have continued to emphasize fundraising, fee earnings, and the build-out of digital infrastructure investment strategies. A major catalyst is the industry-wide need for new capital to finance AI-oriented data center expansion, power-dense computing facilities, fiber connectivity, and mobile network densification. If DigitalBridge continues to win mandates in these areas, the company could deepen its role as a specialist intermediary between institutional capital and infrastructure demand.
Earnings per share show a business that has moved from losses toward modest profitability, but not yet to a level that looks firmly established over a long period. That is encouraging in direction, though it still leaves room for questions about how durable normalized earnings may be through a full market cycle.
Book value per share has recovered from earlier disruption and has been rebuilding, another sign that the restructuring phase has become less severe. Still, the five-year trend remains weaker than the sector median, which means the recovery is real but not yet enough to erase the damage from prior years.
One especially notable point is that recent year-over-year revenue growth has been very strong, but that should be read carefully. It likely reflects both improving operations and the impact of prior portfolio changes, which can make comparisons look unusually sharp. For long-term analysis, the more important question is whether DigitalBridge can consistently grow fee-bearing capital and fee-related earnings rather than simply post a strong rebound after a transition year.
Risks
This article is for informational purposes only and does not constitute financial advice. Some content is AI-generated. See Disclaimer


