Stock Analysis · CoreCivic Inc (CXW)
Overview
CoreCivic Inc is a U.S. company that works with government agencies in corrections, detention, and community reentry. Its business is built around owning or managing secure facilities and providing related services under contracts, mainly for federal agencies, state governments, and local authorities. In simple terms, it helps governments house inmates and detainees, and it also operates facilities and programs designed to support people transitioning back into the community.
The company reports its business in three main segments. Based on recent annual reporting, revenue is concentrated in correctional and detention operations, with a smaller contribution from leasing real estate and from reentry services.
- Safety segment: approximately 80% to 85% of revenue. This is the largest activity and includes managing correctional and detention facilities for government customers, along with daily operations such as security, food, healthcare coordination, and facility support.
- Community segment: approximately 8% to 12% of revenue. This includes residential reentry centers and non-residential services such as electronic monitoring, case management, and programs intended to help individuals reintegrate after release.
- Properties segment: approximately 8% to 12% of revenue. This segment leases prison and detention real estate to government agencies and can produce relatively steady rental-type income when facilities are occupied.
CoreCivic is not a typical industrial company despite its sector classification. It is closer to a specialized government contractor with a large real estate base. That combination matters for long-term analysis: the business depends heavily on public policy and contract awards, but it also owns hard assets that can create recurring income and strategic value.
The flow of income and costs over recent years shows a business that has returned to revenue growth and improved net income after a weaker period. It also shows that operating costs remain substantial, which is normal in a labor-intensive business where staffing and facility expenses are central to service delivery.
Key Figures
| Metric | Value | Sector ⓘ |
|---|---|---|
| Date | Oct 24, 2026 | |
| Context | ||
| Sector | Industrials | |
| Industry | Security & Protection Services | |
| Market Cap ⓘ | $3.00B | |
| Beta ⓘ | 0.57 | |
Value (Cheapness) | ||
| P/E Ratio ⓘ | 24.27 | 22.29 |
| P/B Ratio ⓘ | 2.13 | 1.98 |
| FCF Yield ⓘ | 1.91% | 6.26% |
| Dividend Yield ⓘ | N/A | 1.92% |
| EBIT / EV ⓘ | 5.56% | 4.83% |
| PEG ⓘ | 1.06 | |
Growth (Business expansion) | ||
| Revenue Growth ⓘ | 27.30% | 9.30% |
| RPS Growth (5Y CAGR) ⓘ | 7.27% | 7.76% |
| EPS Growth (5Y CAGR) ⓘ | 17.40% | -13.17% |
| BVPS Growth (5Y CAGR) ⓘ | 3.37% | 6.13% |
| Margin Growth (5Y Trend) ⓘ | 0.71% | 0.74% |
| FCF Growth (5Y CAGR) ⓘ | -26.24% | 10.79% |
| DPS Growth (5Y CAGR) ⓘ | -62.39% | 9.41% |
Quality (Business durability) | ||
| ROIC (Latest) ⓘ | 6.81% | 10.75% |
| ROA (Latest) ⓘ | 3.90% | 5.41% |
| ROIC (5Y Median) ⓘ | 4.73% | 9.37% |
| ROA (5Y Median) ⓘ | 2.28% | 4.95% |
| Net Debt / EBIT (Latest) ⓘ | 5.03 | 2.04 |
| Net Debt / EBIT (5Y Median) ⓘ | 5.68 | 2.27 |
| Net Debt / EBITDA (Latest) ⓘ | 3.24 | 1.39 |
| Net Debt / Assets ⓘ | 35.83% | 19.27% |
| EBITDA / Interest ⓘ | 5.14 | 9.58 |
| Operating Margin (Latest) ⓘ | 9.91% | 10.49% |
| Operating Margin (5Y Median) ⓘ | 9.22% | 10.30% |
| Debt to Equity (Latest) ⓘ | 93.64% | 64.82% |
| Profit Margin (Latest) ⓘ | 5.15% | 6.67% |
| Free Cash Flow (Latest) ⓘ | $57.31M | |
Momentum (Price trend) | ||
| 3Y Return ⓘ | +158.72% | +67.77% |
| 12M Return (excl. last month) ⓘ | +55.00% | +12.05% |
| 6M Return ⓘ | +43.51% | 0.00% |
| Price vs. 200-Day MA ⓘ | +16.36% | +0.67% |
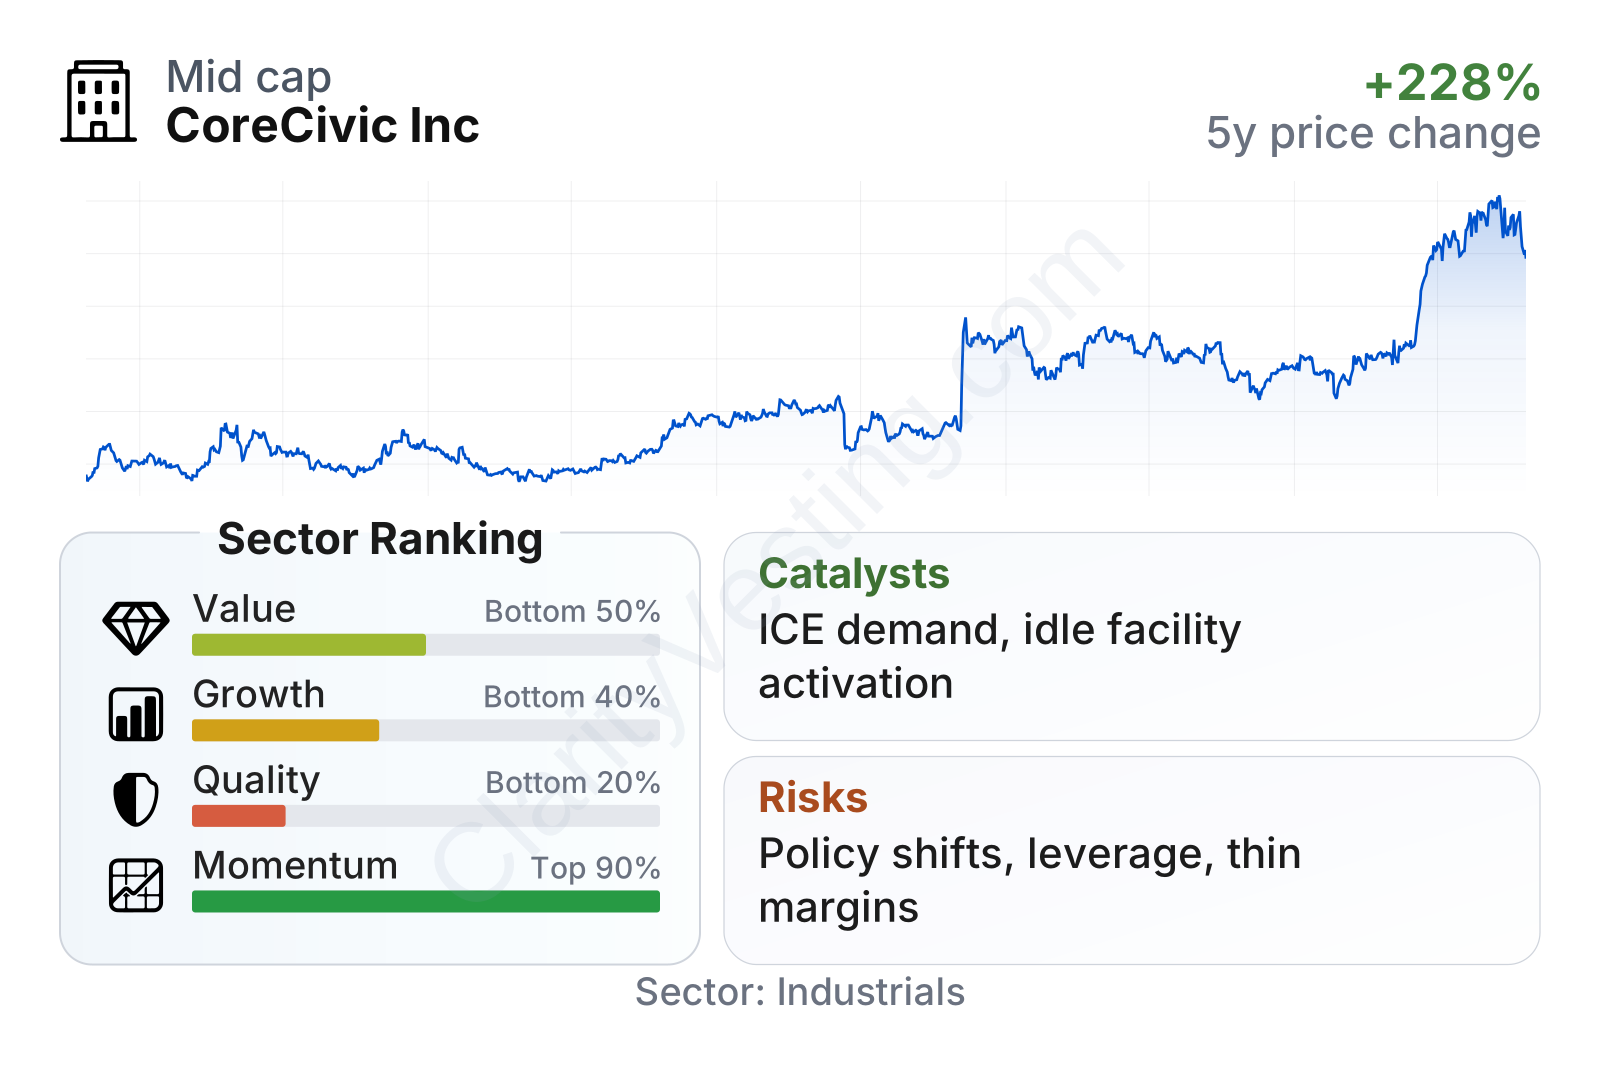
CoreCivic is a mid-sized public company with a stock that has been much stronger than most of its sector over the last one, three, and even six months. The table also points to an important split in the company’s profile: market momentum has been very strong, but quality and value measures are less favorable. Profitability is positive, yet returns on capital remain below sector norms, and leverage is still elevated. That means the market has rewarded the recent turnaround, while the underlying business still has areas that need further improvement to fully match the share-price strength.
Growth
CoreCivic operates in a sector that does not usually grow like technology or consumer internet, but it can still expand when government demand for detention capacity, prison management, monitoring services, and reentry programs rises. Demand is shaped less by the economic cycle than by immigration enforcement priorities, incarceration trends, detention capacity shortages, and public-sector budget choices. That can make the business relatively resilient in some periods, but growth often comes in bursts rather than in a smooth pattern.
Recently, the growth picture has improved. Revenue growth was negative or close to flat for part of 2022, turned modestly positive during 2023, accelerated in 2024, and moved into a much stronger range in 2025 and 2026. The latest year-over-year growth rate is around 27%, clearly above the sector median near 9%. That suggests the company is benefiting from new contracts, higher occupancy, reactivated facilities, or some combination of those factors.
Management’s strategy is fairly easy to understand. CoreCivic is trying to use its existing facility base more efficiently, reactivate idle capacity when demand supports it, expand the use of owned properties, and maintain relationships with government customers that need rapid access to beds and services. For a company with a large fixed asset footprint, filling existing capacity can be more powerful than building from scratch because incremental revenue can improve margins if operating execution is disciplined.
There is also a potential catalyst in federal detention and immigration-related demand. CoreCivic has repeatedly highlighted in company materials that government agencies can face capacity constraints and may need private-sector partners when public facilities are insufficient. If that environment remains tight, the company’s available facilities and operating experience could become more valuable.
Free cash flow, however, shows why the growth case should not be viewed as simple. Over the last several years, cash generation has been uneven, and trailing free cash flow recently dropped to a much lower level than in prior periods. That does not automatically mean the business is weakening, because timing of working capital, spending on reactivated facilities, or other contract-related needs can temporarily pressure cash flow. Still, for a company with meaningful debt, stable cash conversion matters.
A recent positive development is that revenue, gross profit, and net income all improved meaningfully in 2025, while interest expense continued trending down from earlier levels. That combination can support future earnings power if contract utilization remains solid. In short, the near-term operating direction looks better than it did a few years ago, and the company appears to have regained momentum from a stronger demand backdrop.
Risks
This article is for informational purposes only and does not constitute financial advice. Some content is AI-generated. See Disclaimer


