Stock Analysis · Crane NXT Co (CXT)
Overview
Crane NXT Co is an industrial technology company focused on products where security, authentication, and payment reliability matter. After the separation of the broader Crane business, Crane NXT became centered mainly on currency technology and digital payment solutions. In simple terms, it sells equipment, software, and components that help governments protect banknotes and help businesses process electronic payments more securely and efficiently.
The business is generally organized around two main operating areas: Crane Currency and Crane Payment Innovations. Crane Currency serves central banks and banknote printers with security features used in paper currency, while Crane Payment Innovations provides payment hardware and software used in vending, retail, self-service, gaming, transit, and unattended payment environments.
Based on recent company reporting, revenue is primarily split between these sources:
- Payment & merchandising technologies: approximately 60% to 65% of revenue. This includes payment acceptance components, software, connectivity tools, and automation technologies used in vending machines, self-checkout, kiosks, transit systems, and other unattended retail settings.
- Currency security products: approximately 35% to 40% of revenue. This includes micro-optic security threads and other authentication features embedded in banknotes, along with related design and production services for central banks and currency printers.
This mix matters because it gives Crane NXT exposure to two different markets: one tied to the long replacement cycle of national currency programs, and another tied to the growth of automated and digital payment infrastructure.
Over the last several years, revenue has moved upward overall, but the path has not been smooth. Sales rose from roughly $1.35 billion in 2021 to about $1.66 billion in 2025. At the same time, profitability has tightened, with net income falling from about $178 million to around $145 million over that period. That combination suggests a company that is still growing its top line, but with more pressure on costs and financing than before.
The long-term pattern shows revenue expanding while a larger share of sales is being absorbed by production costs, operating expenses, and interest expense. Gross profit has increased in dollars, but not as quickly as revenue, which helps explain why earnings have been under more pressure.
Key Figures
| Metric | Value | Sector ⓘ |
|---|---|---|
| Date | Oct 03, 2026 | |
| Context | ||
| Sector | Industrials | |
| Industry | Business Equipment & Supplies | |
| Market Cap ⓘ | $2.71B | |
| Beta ⓘ | 1.07 | |
Value (Cheapness) | ||
| P/E Ratio ⓘ | 19.42 | 22.45 |
| P/B Ratio ⓘ | 2.19 | 1.98 |
| FCF Yield ⓘ | 7.39% | 6.31% |
| Dividend Yield ⓘ | 1.47% | 1.96% |
| EBIT / EV ⓘ | 5.29% | 4.81% |
| PEG ⓘ | N/A | |
Growth (Business expansion) | ||
| Revenue Growth ⓘ | 22.00% | 9.10% |
| RPS Growth (5Y CAGR) ⓘ | 4.75% | 7.75% |
| EPS Growth (5Y CAGR) ⓘ | -33.58% | -13.59% |
| BVPS Growth (5Y CAGR) ⓘ | -9.58% | 6.22% |
| Margin Growth (5Y Trend) ⓘ | -6.55% | 0.72% |
| FCF Growth (5Y CAGR) ⓘ | -18.28% | 10.98% |
| DPS Growth (5Y CAGR) ⓘ | -21.54% | 9.48% |
Quality (Business durability) | ||
| ROIC (Latest) ⓘ | 6.73% | 10.92% |
| ROA (Latest) ⓘ | 4.31% | 5.41% |
| ROIC (5Y Median) ⓘ | 9.59% | 9.21% |
| ROA (5Y Median) ⓘ | 6.19% | 4.94% |
| Net Debt / EBIT (Latest) ⓘ | 5.81 | 2.07 |
| Net Debt / EBIT (5Y Median) ⓘ | 2.14 | 2.28 |
| Net Debt / EBITDA (Latest) ⓘ | 4.24 | 1.43 |
| Net Debt / Assets ⓘ | 34.37% | 19.27% |
| EBITDA / Interest ⓘ | 4.09 | 9.53 |
| Operating Margin (Latest) ⓘ | 11.80% | 10.50% |
| Operating Margin (5Y Median) ⓘ | 20.87% | 10.27% |
| Debt to Equity (Latest) ⓘ | 115.86% | 65.48% |
| Profit Margin (Latest) ⓘ | 7.78% | 6.62% |
| Free Cash Flow (Latest) ⓘ | $199.90M | |
Momentum (Price trend) | ||
| 3Y Return ⓘ | -12.04% | +58.56% |
| 12M Return (excl. last month) ⓘ | -16.91% | +15.63% |
| 6M Return ⓘ | +16.98% | +4.19% |
| Price vs. 200-Day MA ⓘ | +0.30% | +0.93% |
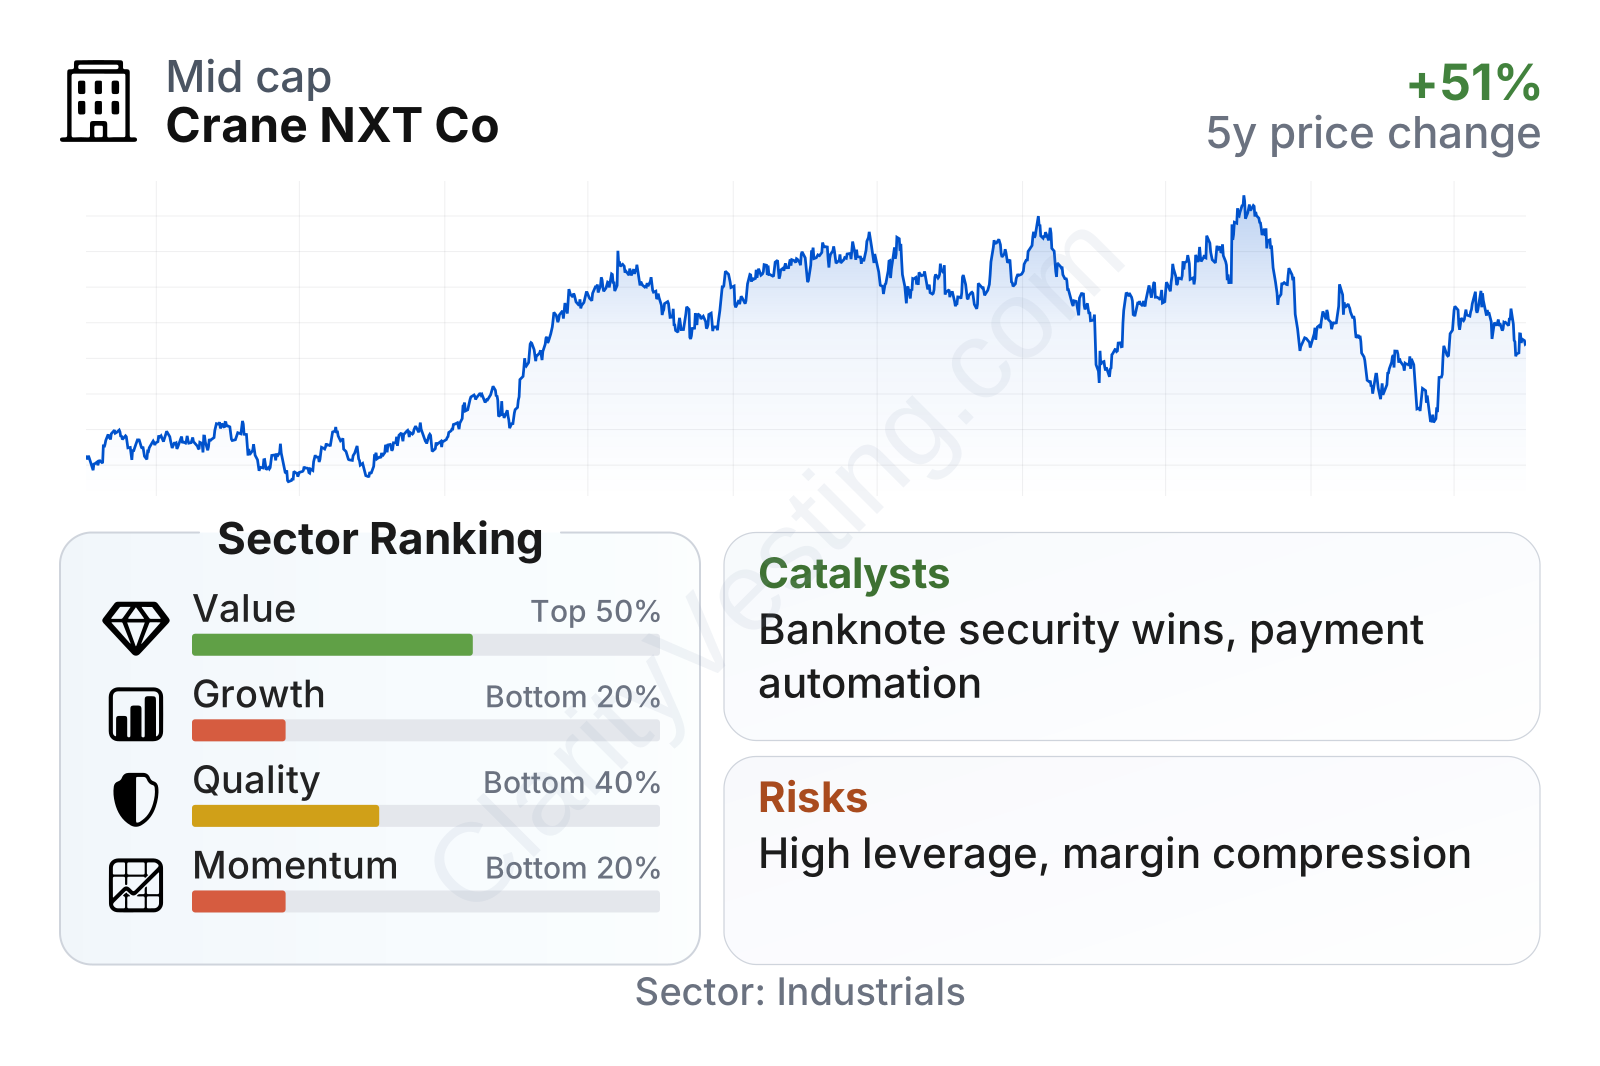
Crane NXT sits in the mid-cap range, with share-price behavior close to the broader market in volatility terms. The table points to a mixed profile: valuation looks moderate relative to the industrial sector, cash generation is respectable, but growth, balance-sheet strength, and recent stock momentum rank weaker versus many peers. That combination usually describes a company where execution and debt reduction matter more than simple revenue expansion.
The stock’s multi-year path has been volatile rather than steadily upward. After a strong climb through parts of 2023 and 2024, the shares pulled back sharply and then partially recovered. That kind of pattern often reflects a business that investors view as solid but not yet fully predictable in its earnings path.
Growth
Crane NXT operates in markets that have credible long-term demand drivers. In payments, retailers and service operators continue shifting toward self-service, unattended checkout, connected machines, and more software-based management of cash and electronic transactions. In currency, cash usage may be under pressure in some developed markets, but central banks still invest in anti-counterfeiting technology, redesign programs, and more secure banknotes. That means the company is not in a rapidly disappearing niche; it is exposed to markets that are changing, but still structurally important.
Its strategy also makes sense on paper. The company combines a specialized, high-value currency security business with a broader installed-base payments business. One side can benefit from long contract cycles and technical barriers to entry, while the other can benefit from recurring aftermarket demand, service, upgrades, and software opportunities. That creates some diversification inside a relatively focused industrial technology group.
Recent revenue growth has improved meaningfully. The latest year-over-year growth rate is above 20%, clearly ahead of the sector median. More importantly, the recent trend shows several consecutive quarters of positive expansion after earlier volatility. That supports the view that demand has strengthened, even if the historical record remains uneven because of portfolio changes and project timing.
Cash generation is another point worth watching closely. Free cash flow remains positive and has recovered from prior lows, although it is still below the much stronger level reached earlier in the cycle. For a company like Crane NXT, this matters because cash flow is what ultimately supports debt reduction, dividends, acquisitions, and internal investment.
A potential catalyst is the company’s positioning in authentication and secure transaction infrastructure. Central banks do not change banknote security features casually; once a technology is selected, it can remain embedded for years. In parallel, payment operators increasingly want hardware linked with software, telemetry, and device intelligence. Crane NXT already participates in those areas, so even moderate success in cross-selling and product upgrades can have a meaningful effect over time.
Another positive element is that recent revenue momentum appears stronger than its longer five-year record. That does not erase the weaker long-term trend shown in earnings and cash flow growth, but it does suggest the current operating period may be better than what backward-looking averages alone would imply.
Risks
This article is for informational purposes only and does not constitute financial advice. Some content is AI-generated. See Disclaimer


