Stock Analysis · California Water Service Group (CWT)
Overview
California Water Service Group is a regulated water utility. Through its main subsidiary, California Water Service, the company provides drinking water service, wastewater service, and a smaller set of related utility activities to residential, commercial, industrial, and public-authority customers. Its service areas are concentrated in California, with additional operations in Washington, New Mexico, Hawaii, and Texas. For a long-term reader, the key point is that this is not a fast-changing technology business: it is an infrastructure-heavy utility whose earnings depend largely on customer demand, regulation, and the pace at which it can invest in pipes, treatment facilities, storage, and other water systems.
The business model is fairly straightforward. California Water Service Group spends heavily to maintain and expand essential water infrastructure, then seeks to recover those costs and earn an authorized return through rates approved by state regulators. That makes revenue more predictable than in many industries, but it also means growth tends to be tied to regulatory outcomes and capital spending rather than sudden jumps in demand.
Based on the company’s recent annual reporting, revenue is overwhelmingly tied to regulated utility operations. The mix can shift somewhat from year to year because of balancing accounts, conservation effects, and regulatory adjustments, but the broad picture is clear.
- Regulated water service: about 90% to 95% of total revenue. This includes charges for delivering potable water to homes, businesses, and public entities.
- Other utility and service revenue: about 5% to 10%. This generally includes wastewater operations, late fees, infrastructure-related surcharges, and other tariff-based or closely related activities.
- Non-utility activity: minimal. The company is primarily a pure-play regulated water utility rather than a diversified infrastructure group.
The recent financial flow also shows a business that can swing meaningfully from year to year depending on rate cases and cost recovery. Revenue moved from roughly $0.8 billion to around $1.0 billion over the last several years, while net income and gross profit were notably weaker in 2023 and then recovered sharply in 2024 before easing again in 2025. That pattern reinforces how important regulation and timing are to the company’s results.
Key Figures
| Metric | Value | Sector ⓘ |
|---|---|---|
| Date | Oct 03, 2026 | |
| Context | ||
| Sector | Utilities | |
| Industry | Utilities - Regulated Water | |
| Market Cap ⓘ | $2.83B | |
| Beta ⓘ | 0.49 | |
Value (Cheapness) | ||
| P/E Ratio ⓘ | 20.46 | 16.80 |
| P/B Ratio ⓘ | 1.55 | 1.48 |
| FCF Yield ⓘ | -8.32% | 0.64% |
| Dividend Yield ⓘ | 2.78% | 3.91% |
| EBIT / EV ⓘ | 5.11% | 5.01% |
| PEG ⓘ | 2.22 | |
Growth (Business expansion) | ||
| Revenue Growth ⓘ | 16.50% | 6.00% |
| RPS Growth (5Y CAGR) ⓘ | 2.29% | 4.14% |
| EPS Growth (5Y CAGR) ⓘ | -14.00% | -11.39% |
| BVPS Growth (5Y CAGR) ⓘ | 5.94% | 4.29% |
| Margin Growth (5Y Trend) ⓘ | 2.61% | 3.55% |
| FCF Growth (5Y CAGR) ⓘ | N/A | -9.10% |
| DPS Growth (5Y CAGR) ⓘ | 7.77% | 4.51% |
Quality (Business durability) | ||
| ROIC (Latest) ⓘ | 6.08% | 6.53% |
| ROA (Latest) ⓘ | 2.32% | 3.19% |
| ROIC (5Y Median) ⓘ | 5.89% | 6.12% |
| ROA (5Y Median) ⓘ | 2.54% | 2.76% |
| Net Debt / EBIT (Latest) ⓘ | 7.13 | 7.15 |
| Net Debt / EBIT (5Y Median) ⓘ | 7.23 | 7.24 |
| Net Debt / EBITDA (Latest) ⓘ | 4.38 | 4.40 |
| Net Debt / Assets ⓘ | 27.44% | 39.16% |
| EBITDA / Interest ⓘ | 5.12 | 4.41 |
| Operating Margin (Latest) ⓘ | 21.74% | 20.93% |
| Operating Margin (5Y Median) ⓘ | 18.75% | 20.18% |
| Debt to Equity (Latest) ⓘ | 92.68% | 140.88% |
| Profit Margin (Latest) ⓘ | 12.63% | 11.32% |
| Free Cash Flow (Latest) ⓘ | -$235.73M | |
Momentum (Price trend) | ||
| 3Y Return ⓘ | +5.41% | +48.75% |
| 12M Return (excl. last month) ⓘ | +9.55% | +11.24% |
| 6M Return ⓘ | +3.53% | -3.69% |
| Price vs. 200-Day MA ⓘ | +0.92% | -1.97% |
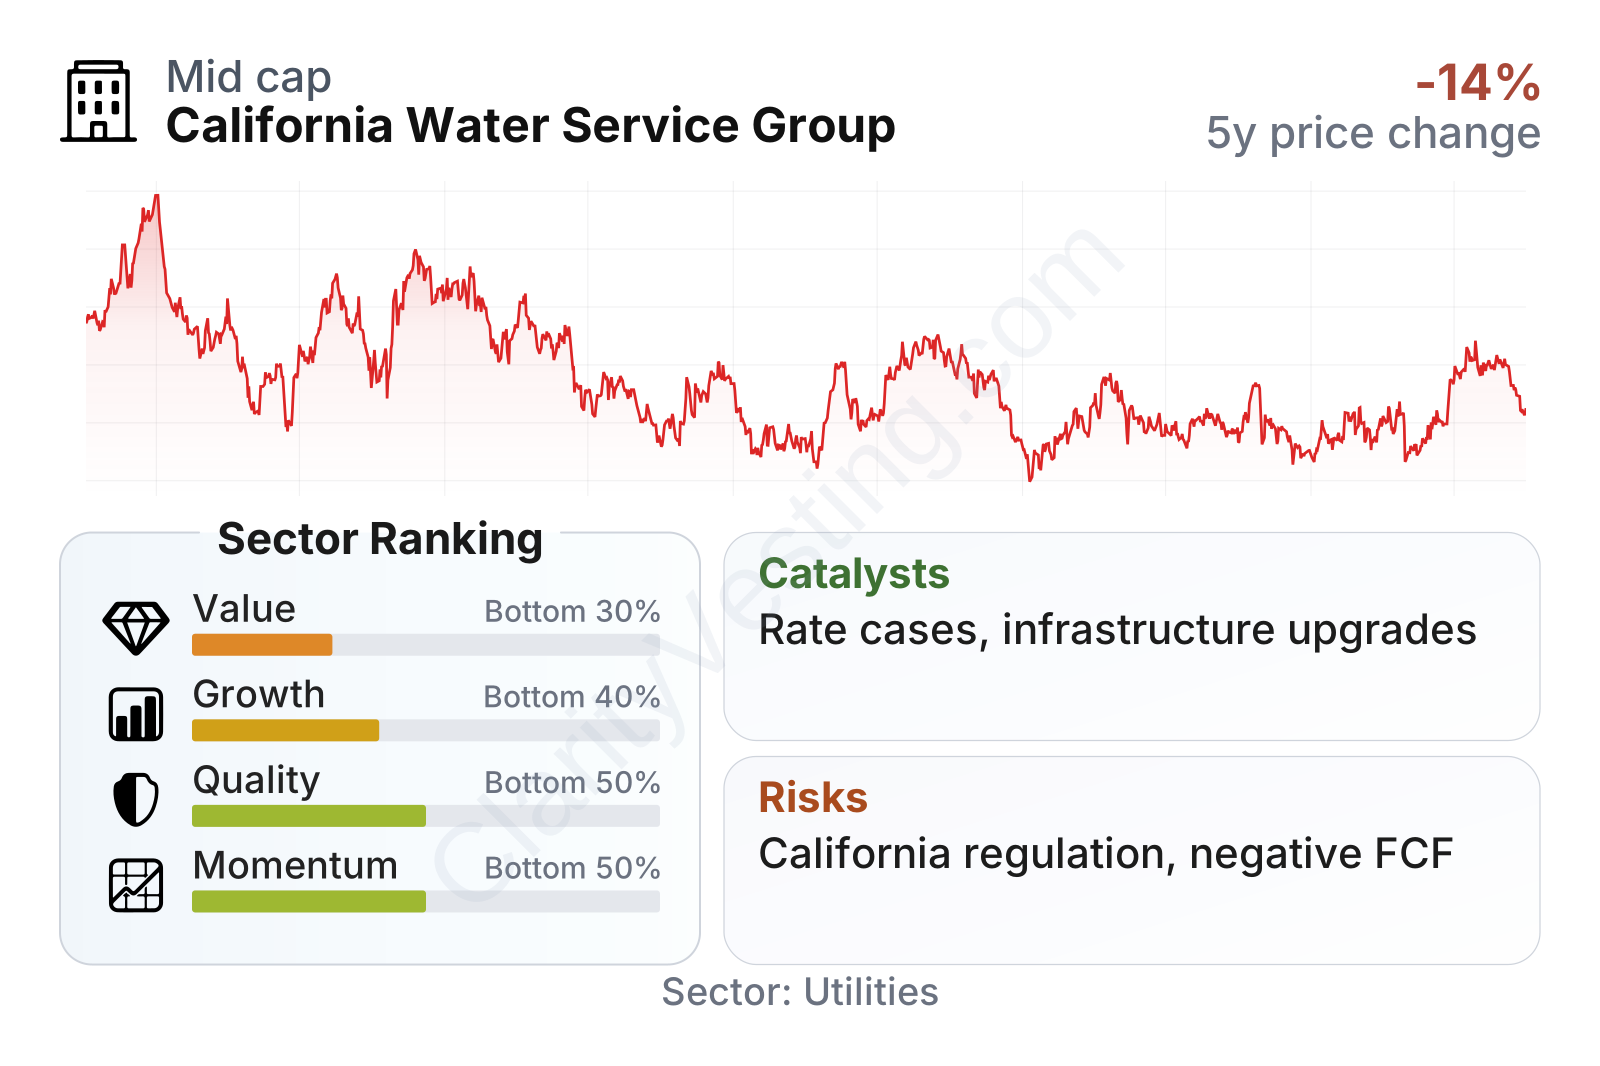
California Water Service Group is a mid-sized regulated water utility with a low-beta profile, which fits the defensive character usually associated with essential-service utilities. The table points to a mixed setup. Relative to the broader utilities universe, valuation is somewhat richer, while growth, quality, and momentum rank in the lower half of the sector. The strongest recent points are above-median year-over-year revenue growth, better-than-sector profit margin, and a balance sheet that uses less leverage than many peers. The weaker areas are negative free cash flow, modest long-term revenue-per-share growth, and earnings growth that has been under pressure over a five-year view.
Growth
Water is an essential service, and that gives the industry durable long-term demand. Population needs, water quality standards, aging infrastructure, wildfire resilience, drought adaptation, and stricter environmental rules all support continued investment across regulated water systems. That does not automatically create rapid growth, but it does create a long runway for capital deployment. In this sector, growth often comes from building and upgrading infrastructure that can later be added to the regulated asset base, which may support future earnings if regulators approve cost recovery.
California Water Service Group’s strategy is aligned with that model. The company has continued to invest in infrastructure renewal and system resilience, including water supply reliability, storage, treatment, and fire-hardening efforts. In practical terms, this matters because regulated utilities can often grow by increasing the value of assets in service rather than by relying only on higher customer usage. That is especially relevant in water, where conservation can limit volume growth.
Revenue per share has been uneven rather than steadily rising, with a decline in 2023, a strong rebound in 2024, and some moderation after that. Over five years, the growth rate is positive but not especially strong compared with the sector median. This suggests that the company’s long-term expansion case rests more on future rate-base growth and approved pricing than on a powerful recent record of compounding top-line performance per share.
A meaningful catalyst is the company’s exposure to rate cases and authorized capital programs in California and its other jurisdictions. When a utility secures approval for infrastructure spending and an adequate allowed return, that can improve revenue visibility for several years. Another favorable element is the broader need for water-system investment in the western United States, where drought resilience, supply reliability, and fire protection remain major themes.
Recent company communications have also emphasized infrastructure investment and regulatory filings as central drivers of future results. For a business like CWT, these developments matter more than short-term economic cycles. If approved outcomes are constructive, they can provide a clearer path for earnings recovery and dividend support over time.
Free cash flow has remained deeply negative, but this is not unusual for a utility in a heavy investment phase. The important distinction is whether the spending is productive and recoverable through future rates. Negative free cash flow in this context reflects the capital intensity of the business more than a simple operating weakness, although it still raises the importance of financing discipline and regulatory execution.
Risks
This article is for informational purposes only and does not constitute financial advice. Some content is AI-generated. See Disclaimer


