Stock Analysis · Cushman & Wakefield plc (CWK)
Overview
Cushman & Wakefield plc is a global commercial real estate services company. It advises property owners, occupiers, and investors on leasing, capital markets transactions, property management, project management, valuation, and workplace-related services. In simple terms, the company helps businesses and property investors rent, buy, sell, finance, manage, and improve office buildings, industrial facilities, retail space, and other commercial properties.
Its business model is a mix of recurring service revenue and more cyclical transaction revenue. Recurring activities such as facilities management, property management, and valuation tend to be steadier, while leasing and capital markets are more sensitive to the health of the property cycle and interest rates.
Based on the company’s recent annual reporting structure, the main revenue sources are approximately:
- Property, Facilities, and Project Management — about 50% to 55%: ongoing management of buildings and workplaces, maintenance coordination, project execution, and related services. This is the largest and generally the most recurring part of the business.
- Leasing — about 20% to 25%: advising landlords and tenants on office, industrial, and retail leases. Revenue depends heavily on market activity.
- Capital Markets — about 10% to 15%: investment sales, debt and equity placement, and related advisory work for commercial properties. This tends to be one of the most cyclical activities.
- Valuation and Other — about 10% to 15%: appraisal, consulting, and other advisory services.
This mix matters for long-term analysis because Cushman & Wakefield is not simply a property owner collecting rent. It is a service platform whose results depend on client relationships, transaction volumes, outsourcing demand, and operating discipline.
Looking at the recent income flow, revenue has moved around the $9 billion to $10 billion range over the last several years, while profits have been much more volatile. Gross profit has stayed meaningful, but interest expense and thin operating margins have limited how much of that revenue becomes net income. That pattern is typical of a people-intensive advisory business with meaningful debt and cyclical end markets.
Key Figures
| Metric | Value | Sector ⓘ |
|---|---|---|
| Date | Oct 17, 2026 | |
| Context | ||
| Sector | Real Estate | |
| Industry | Real Estate Services | |
| Market Cap ⓘ | $2.59B | |
| Beta ⓘ | 1.51 | |
Value (Cheapness) | ||
| P/E Ratio ⓘ | 39.43 | 17.38 |
| P/B Ratio ⓘ | 1.36 | 0.85 |
| FCF Yield ⓘ | 11.66% | 7.38% |
| Dividend Yield ⓘ | N/A | 4.85% |
| EBIT / EV ⓘ | 5.90% | 3.78% |
| PEG ⓘ | 0.23 | |
Growth (Business expansion) | ||
| Revenue Growth ⓘ | 11.20% | 5.30% |
| RPS Growth (5Y CAGR) ⓘ | 1.41% | 6.02% |
| EPS Growth (5Y CAGR) ⓘ | -30.73% | -11.37% |
| BVPS Growth (5Y CAGR) ⓘ | 6.86% | 0.45% |
| Margin Growth (5Y Trend) ⓘ | -2.32% | -0.22% |
| FCF Growth (5Y CAGR) ⓘ | -12.32% | 5.40% |
| DPS Growth (5Y CAGR) ⓘ | -52.71% | 5.02% |
Quality (Business durability) | ||
| ROIC (Latest) ⓘ | 5.77% | 5.69% |
| ROE (Latest) ⓘ | 3.47% | 7.56% |
| ROA (Latest) ⓘ | 0.91% | 2.85% |
| ROIC (5Y Median) ⓘ | 5.97% | 4.22% |
| ROE (5Y Median) ⓘ | 7.65% | 6.03% |
| ROA (5Y Median) ⓘ | 1.71% | 2.44% |
| Net Debt / EBIT (Latest) ⓘ | 7.90 | 7.59 |
| Net Debt / EBIT (5Y Median) ⓘ | 6.49 | 8.40 |
| Net Debt / EBITDA (Latest) ⓘ | 4.70 | 5.27 |
| Net Debt / Assets ⓘ | 33.48% | 37.76% |
| EBITDA / Interest ⓘ | 2.45 | 4.10 |
| Operating Margin (Latest) ⓘ | 2.96% | 35.29% |
| Operating Margin (5Y Median) ⓘ | 4.11% | 37.31% |
| Debt to Equity (Latest) ⓘ | 149.86% | 88.87% |
| Profit Margin (Latest) ⓘ | 0.64% | 19.61% |
| Free Cash Flow (Latest) ⓘ | $302.10M | |
Momentum (Price trend) | ||
| 3Y Return ⓘ | +55.01% | +30.75% |
| 12M Return (excl. last month) ⓘ | -24.80% | +4.36% |
| 6M Return ⓘ | -16.41% | -2.52% |
| Price vs. 200-Day MA ⓘ | -14.83% | -2.34% |
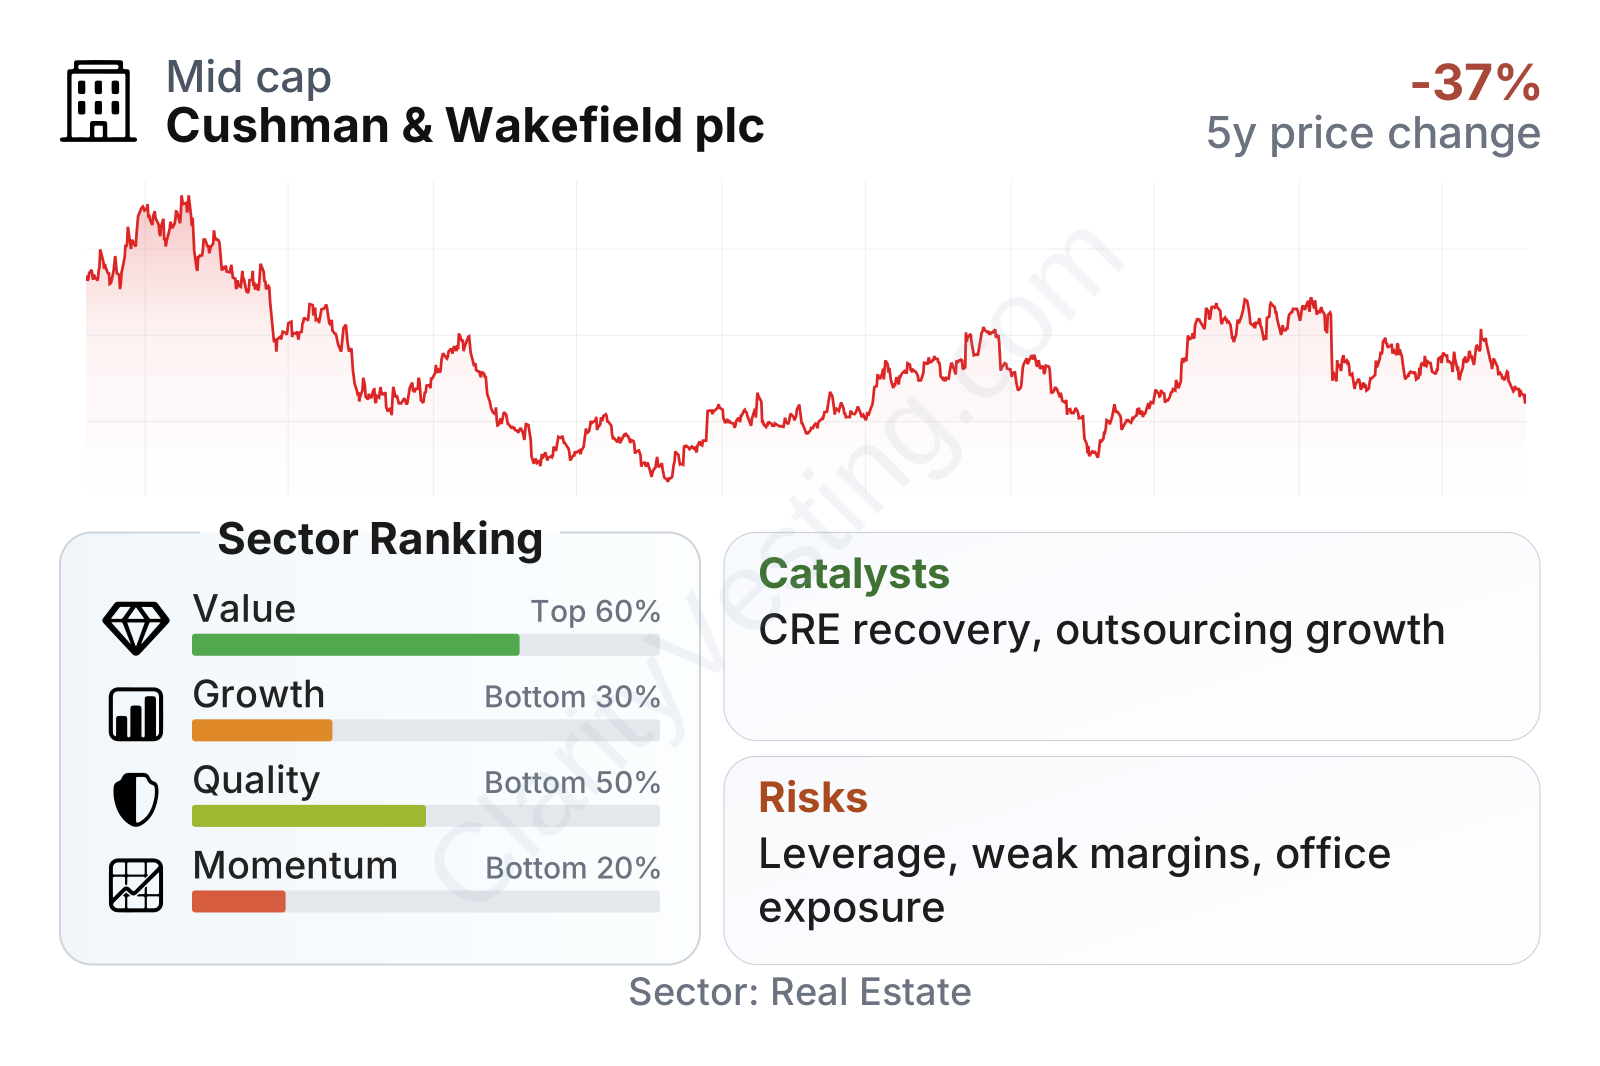
Cushman & Wakefield is a mid-sized public company within real estate services, and the share price has been notably volatile over the past few years. The stock fell sharply during the commercial real estate slowdown, then recovered, but recent momentum has weakened again. In the latest factor snapshot, valuation signals are mixed: cash flow-based measures look better than the sector median, while the earnings multiple is high. Quality and growth measures are weaker, reflecting low margins, modest returns on assets, and an uneven earnings record.
The picture is therefore not one of a simple bargain or a simple premium. The business produces meaningful revenue and free cash flow, but the translation into durable profitability has been less convincing than for stronger peers.
Growth
Cushman & Wakefield operates in a sector that should have long-term relevance, even if the current environment remains uneven. Commercial property owners and occupiers still need brokerage, valuation, facilities management, and project execution. Over time, outsourcing trends can support growth because many large clients prefer to hand workplace and property operations to specialized firms with global scale.
The strongest structural growth angle is not office leasing itself, which remains pressured in many markets, but the broader outsourcing and services platform. Facilities management, project management, and corporate occupier services can benefit from workplace redesign, cost-control programs, logistics expansion, data center activity, and the growing complexity of running multi-country property portfolios.
The company’s strategy broadly makes sense for this backdrop. It combines recurring service lines with cyclical advisory businesses, which can create operating leverage when transaction markets recover. If interest rates stabilize or decline over time, capital markets and leasing activity could improve from depressed levels, giving Cushman & Wakefield a tailwind on top of its more stable service revenue.
Revenue per share has been relatively flat over the past several years rather than consistently compounding upward. That does not suggest a high-growth profile today, but it does show that the company has largely preserved its revenue base through a difficult commercial real estate cycle. For a services firm tied to property transactions, resilience can matter almost as much as expansion during downturns.
The dividend is not currently a major part of the long-term case. The historical record shows only a limited payout history, which fits a company prioritizing balance sheet management and operating flexibility over shareholder distributions.
A key catalyst is any broad recovery in commercial real estate transactions. Investment sales and leasing volumes have been subdued by financing costs and uncertainty around property values. A better lending backdrop could lift fee income disproportionately because transaction businesses tend to rebound sharply once confidence returns. In addition, continued cost discipline and productivity initiatives could help convert more revenue into operating profit than the company has recently achieved.
Another area worth watching is the company’s position in industrial, logistics, and infrastructure-adjacent real estate services. These areas have remained more resilient than traditional office in many markets, and they fit well with global occupier demand and project work.
Risks
This article is for informational purposes only and does not constitute financial advice. Some content is AI-generated. See Disclaimer


