Stock Analysis · Clearway Energy Inc (CWEN)
Overview
Clearway Energy Inc. is a U.S. power company focused mainly on clean electricity. It owns a large portfolio of renewable energy assets, especially wind and solar projects, and also owns a smaller group of natural gas-fired power plants and district energy systems. Its business model is relatively simple: build or acquire energy assets, sign long-term contracts to sell electricity or capacity, collect recurring cash flows, and use that cash to fund operations, debt service, dividends, and new investments.
For long-term analysis, the key point is that Clearway is not primarily a technology developer or an equipment manufacturer. It is closer to an infrastructure owner. That matters because infrastructure-style businesses usually depend less on rapid product innovation and more on contract quality, financing costs, asset performance, and disciplined capital allocation.
Based on recent company reporting, revenue comes from a mix of contracted power generation and thermal infrastructure services. The broad sources of revenue can be summarized as follows:
- Renewable power generation: approximately 70% to 80% of revenue. This includes electricity and environmental attributes from utility-scale wind, solar, and some battery-linked assets under long-term power purchase agreements.
- Flexible and dispatchable generation: approximately 15% to 25% of revenue. This mainly includes natural gas generation assets that provide power and capacity to the grid and can support reliability when renewable output varies.
- Thermal and distributed infrastructure: approximately 5% to 10% of revenue. This includes steam, hot water, chilled water, and related energy services for commercial or institutional customers.
The overall business mix makes Clearway a hybrid: it is clearly renewable-led, but it still benefits from conventional assets that can stabilize cash generation. That can be useful in a sector where weather and power prices can create volatility.
Revenue has grown gradually over the last several years, but the bigger long-term attraction is usually cash generation rather than rapid sales expansion. The company’s financial flow also shows a familiar pattern for asset-heavy utilities: meaningful gross profit, a large interest burden, and net income that can swing because of financing costs, non-cash items, and asset-level accounting. In other words, this is a business that often looks stronger on contracted cash flow than on headline earnings alone.
The long-term pattern points to fairly steady revenue, while profits have been more uneven because interest expense remains significant. That reinforces the idea that Clearway should be understood as a capital-intensive power owner where financing structure matters almost as much as operating performance.
Key Figures
| Metric | Value | Sector ⓘ |
|---|---|---|
| Date | Oct 17, 2026 | |
| Context | ||
| Sector | Utilities | |
| Industry | Utilities - Renewable | |
| Market Cap ⓘ | $7.51B | |
| Beta ⓘ | 0.89 | |
Value (Cheapness) | ||
| P/E Ratio ⓘ | 39.52 | 17.28 |
| P/B Ratio ⓘ | 2.07 | 1.51 |
| FCF Yield ⓘ | 8.94% | 0.65% |
| Dividend Yield ⓘ | 6.00% | 3.77% |
| EBIT / EV ⓘ | 1.45% | 5.01% |
| PEG ⓘ | 3.41 | |
Growth (Business expansion) | ||
| Revenue Growth ⓘ | 22.70% | 6.10% |
| RPS Growth (5Y CAGR) ⓘ | 2.24% | 3.87% |
| EPS Growth (5Y CAGR) ⓘ | N/A | -11.30% |
| BVPS Growth (5Y CAGR) ⓘ | 50.57% | 4.23% |
| Margin Growth (5Y Trend) ⓘ | -4.53% | 3.57% |
| FCF Growth (5Y CAGR) ⓘ | -9.50% | -8.84% |
| DPS Growth (5Y CAGR) ⓘ | 7.05% | 4.84% |
Quality (Business durability) | ||
| ROIC (Latest) ⓘ | 3.52% | 6.53% |
| ROA (Latest) ⓘ | 0.55% | 3.20% |
| ROIC (5Y Median) ⓘ | 2.21% | 5.95% |
| ROA (5Y Median) ⓘ | 0.61% | 2.75% |
| Net Debt / EBIT (Latest) ⓘ | 41.73 | 7.13 |
| Net Debt / EBIT (5Y Median) ⓘ | 27.07 | 7.23 |
| Net Debt / EBITDA (Latest) ⓘ | 8.25 | 4.31 |
| Net Debt / Assets ⓘ | 57.47% | 38.42% |
| EBITDA / Interest ⓘ | 2.92 | 4.58 |
| Operating Margin (Latest) ⓘ | 14.68% | 20.83% |
| Operating Margin (5Y Median) ⓘ | 19.99% | 20.08% |
| Debt to Equity (Latest) ⓘ | 180.71% | 137.69% |
| Profit Margin (Latest) ⓘ | 6.42% | 11.37% |
| Free Cash Flow (Latest) ⓘ | $671.00M | |
Momentum (Price trend) | ||
| 3Y Return ⓘ | +63.45% | +52.37% |
| 12M Return (excl. last month) ⓘ | +10.99% | +8.84% |
| 6M Return ⓘ | -24.25% | -3.95% |
| Price vs. 200-Day MA ⓘ | -15.24% | -0.79% |
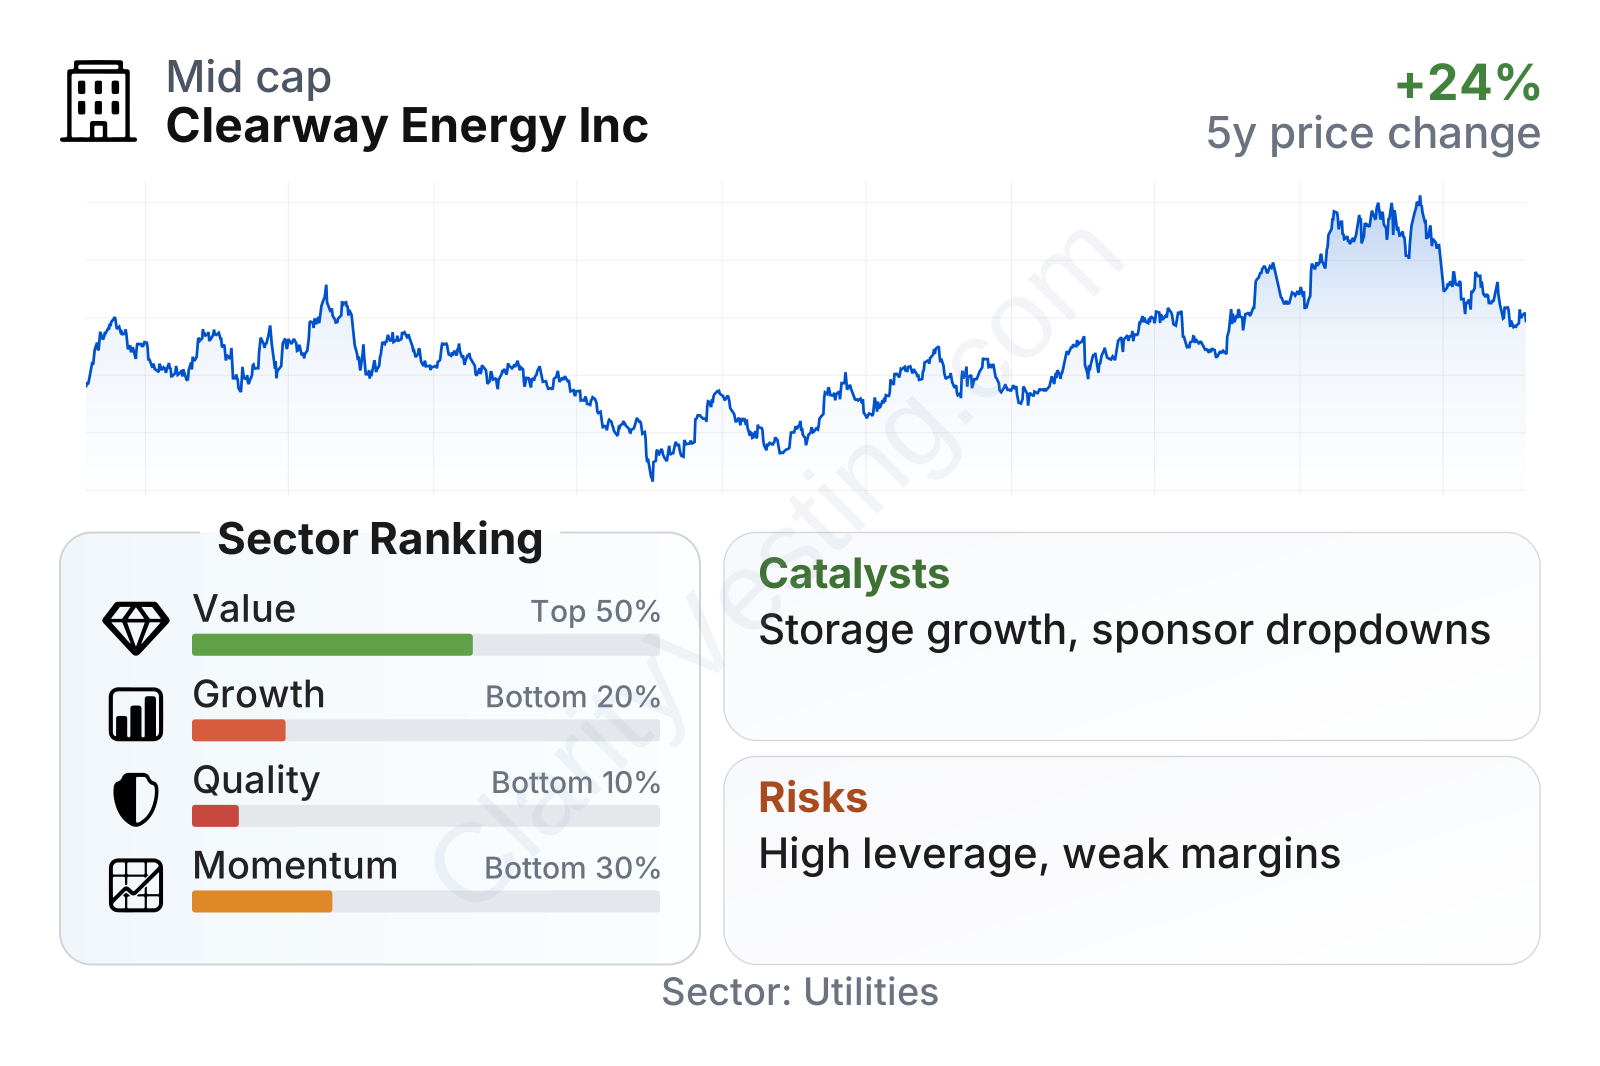
Clearway is a mid-sized renewable utility with relatively low share-price volatility, as shown by a beta below 1. Its profile is mixed. On the positive side, free cash flow yield and dividend yield stand out versus much of the sector, and recent year-over-year revenue growth has been strong. On the weaker side, profitability and balance-sheet quality rank below many peers, with returns on capital, margins, and leverage metrics all looking less favorable. The market is therefore valuing Clearway more as a cash-producing contracted asset platform than as a high-quality compounder.
The stock history also reflects how sensitive this type of company can be to interest-rate expectations. The shares dropped sharply during the 2023 rate shock, then recovered strongly before giving back part of the gains more recently. That pattern is common for yield-oriented utilities and helps explain why market sentiment around Clearway can change quickly even when the underlying asset base moves more slowly.
Growth
Clearway operates in a sector with strong long-term support. U.S. electricity demand is rising from data centers, industrial reshoring, electrification, and grid modernization. At the same time, utilities and corporations continue to sign long-term agreements for renewable power. That creates an attractive backdrop for owners of operating wind and solar assets, especially those with scale, financing access, and development partnerships.
Clearway’s strategy is logical within that context. The company has historically expanded by acquiring contracted projects rather than relying only on building assets from scratch. That can reduce development risk and fit well with its role as a long-duration owner of infrastructure. Its relationship with Clearway Energy Group has also been important because it can provide a pipeline of potential asset dropdowns or co-investment opportunities.
Growth has not been especially fast on a five-year per-share basis, but the direction has still been positive. Revenue per share has trended upward gradually, which suggests the company has been able to expand the asset base without completely diluting the benefit to each share. That is not explosive growth, yet it is consistent with the slow-and-steady nature of contracted power infrastructure.
Cash generation is central to the growth case. Free cash flow weakened from earlier levels and then improved again, which suggests the business retains the capacity to produce meaningful cash despite rate pressure and uneven earnings. A trailing twelve-month free cash flow level in the several-hundred-million-dollar range is material for a company of this size, especially when paired with long-term contracted assets.
Recent company updates in 2026 have continued to emphasize capital recycling, asset optimization, and investment in renewables and storage. Battery storage is an important catalyst because it can increase the value of renewable portfolios by improving dispatch flexibility and grid support. If power demand keeps rising and transmission bottlenecks persist, assets that combine renewable generation with storage could become more valuable over time.
Another important tailwind is policy support. Federal tax incentives for renewable energy, storage, and related infrastructure continue to support project economics in the U.S. While policy details can change, the broader direction still favors companies that already own operating clean-energy assets and have a path to add more.
Risks
This article is for informational purposes only and does not constitute financial advice. Some content is AI-generated. See Disclaimer


