Stock Analysis · Citic Ltd (CTPCY)
Overview
CITIC Limited is one of China’s largest conglomerates. In simple terms, it is a holding company with businesses spread across financial services, natural resources, manufacturing, engineering, infrastructure, and consumer-related activities. The group is controlled by the state-owned CITIC Group and is listed in Hong Kong, while CTPCY is the U.S. ADR. That structure makes the company broad and diversified, but also more complex than a typical single-industry stock.
The biggest profit engine is its financial services arm, especially banking through China CITIC Bank. Beyond finance, CITIC also has major operations in iron ore mining in Australia, special steel production, engineering contracting, heavy machinery, and real estate-related activities. This mix means results depend not only on China’s economy, but also on commodity prices, credit demand, construction activity, and industrial spending.
Based on the company’s latest annual reporting structure, revenue is spread across several major segments, although exact shares can move meaningfully from year to year because commodity prices and project activity can swing sharply.
- Financial services: approximately 35% to 45% of revenue. This mainly includes commercial banking, securities, trust, insurance, and asset management activities.
- Advanced materials and new materials: approximately 20% to 30%. This includes special steel and related industrial materials used in autos, energy, machinery, and manufacturing.
- New consumption: approximately 10% to 20%. This area includes automotive, publishing, and other consumer-facing businesses.
- New-type urbanization: approximately 10% to 15%. This covers engineering, construction, infrastructure, and real estate-related development.
- New industrialization: approximately 5% to 10%. This includes intelligent manufacturing, heavy machinery, and industrial services.
One important point for long-term readers is that revenue does not fully show where economic value is created. Banking and resources can contribute a larger share of earnings than some lower-margin industrial activities. The group’s financial profile therefore reflects a mix of bank-like leverage, cyclical commodity exposure, and industrial operations.
Over the last several years, revenue has stayed very large, but earnings and operating income have been uneven. Gross profit remained relatively stable while operating profit and net income moved around more sharply, showing that scale alone does not guarantee smooth performance.
The business mix provides diversification, but it also explains why the stock can look statistically cheap for long periods: the market is valuing a complicated collection of assets with very different risk profiles rather than a simple pure-play company.
Key Figures
| Metric | Value | Sector ⓘ |
|---|---|---|
| Date | Oct 24, 2026 | |
| Context | ||
| Sector | Industrials | |
| Industry | Conglomerates | |
| Market Cap ⓘ | $45.73B | |
| Beta ⓘ | 0.83 | |
Value (Cheapness) | ||
| P/E Ratio ⓘ | 5.24 | 22.29 |
| P/B Ratio ⓘ | 1.52 | 1.98 |
| FCF Yield ⓘ | 1046.42% | 6.26% |
| Dividend Yield ⓘ | 5.57% | 1.92% |
| EBIT / EV ⓘ | 161.95% | 4.83% |
| PEG ⓘ | N/A | |
Growth (Business expansion) | ||
| Revenue Growth ⓘ | 6.70% | 9.30% |
| RPS Growth (5Y CAGR) ⓘ | 0.28% | 7.76% |
| EPS Growth (5Y CAGR) ⓘ | 55.08% | -13.17% |
| BVPS Growth (5Y CAGR) ⓘ | 17.37% | 6.13% |
| Margin Growth (5Y Trend) ⓘ | 3.08% | 0.74% |
| FCF Growth (5Y CAGR) ⓘ | N/A | 10.79% |
| DPS Growth (5Y CAGR) ⓘ | 0.31% | 9.41% |
Quality (Business durability) | ||
| ROIC (Latest) ⓘ | N/A | 10.75% |
| ROA (Latest) ⓘ | 0.80% | 5.41% |
| ROIC (5Y Median) ⓘ | 4.06% | 9.37% |
| ROA (5Y Median) ⓘ | 0.50% | 4.95% |
| Net Debt / EBIT (Latest) ⓘ | N/A | 2.04 |
| Net Debt / EBIT (5Y Median) ⓘ | 15.02 | 2.27 |
| Net Debt / EBITDA (Latest) ⓘ | N/A | 1.39 |
| Net Debt / Assets ⓘ | 9.51% | 19.27% |
| EBITDA / Interest ⓘ | 2.99 | 9.58 |
| Operating Margin (Latest) ⓘ | 25.60% | 10.49% |
| Operating Margin (5Y Median) ⓘ | 17.47% | 10.30% |
| Debt to Equity (Latest) ⓘ | 326.64% | 64.82% |
| Profit Margin (Latest) ⓘ | 6.28% | 6.67% |
| Free Cash Flow (Latest) ⓘ | $478.53B | |
Momentum (Price trend) | ||
| 3Y Return ⓘ | +120.57% | +67.77% |
| 12M Return (excl. last month) ⓘ | +27.35% | +12.05% |
| 6M Return ⓘ | +1.03% | 0.00% |
| Price vs. 200-Day MA ⓘ | +22.16% | +0.67% |
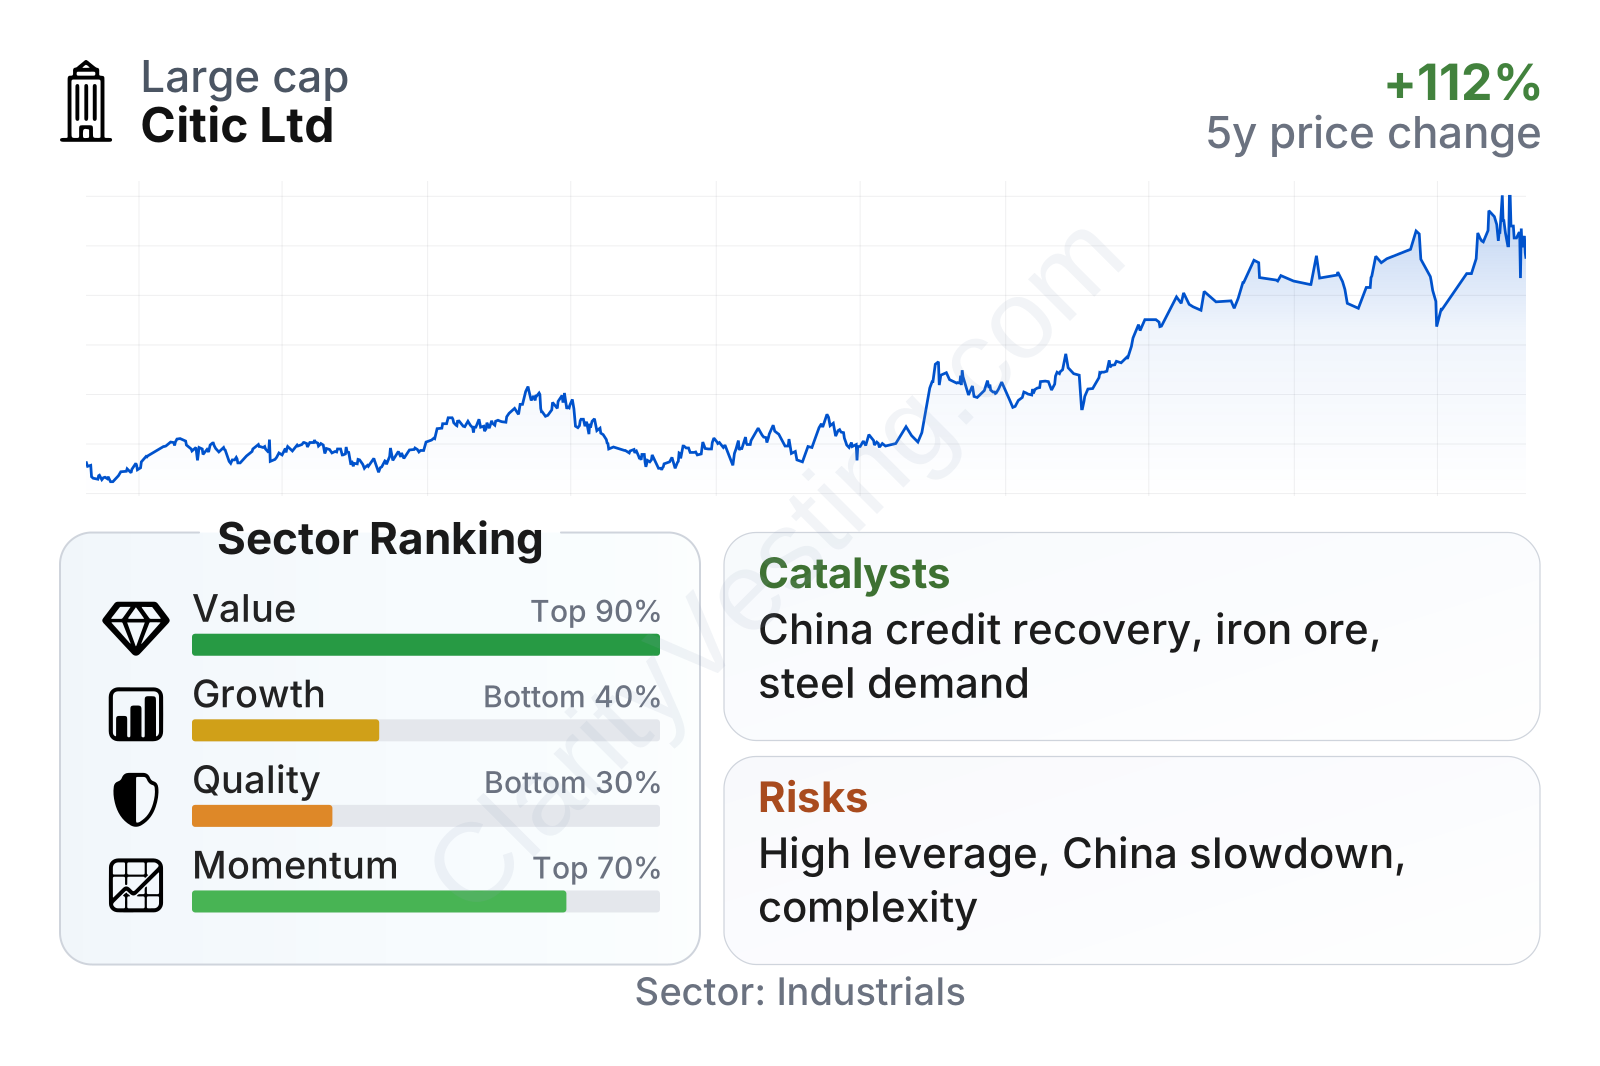
CITIC is a very large company by market value, and its share-price volatility has been somewhat lower than the broader market, with a beta below 1. The most striking feature in the current metrics is valuation: earnings, book value, and cash-flow multiples sit far below the sector median. At the same time, the company ranks poorly on quality and only modestly on growth, which helps explain why the market is not assigning it a richer multiple. Momentum has been stronger, with the stock performing well over the last one-, three-, and six-month periods and over three years.
Growth
CITIC operates in sectors that are important to China’s long-term economic priorities: banking, advanced materials, infrastructure, industrial upgrading, and strategic resources. That creates a foundation for continued relevance. However, it is not a straightforward high-growth company. Its end markets are large, but many of them are mature, cyclical, or closely tied to policy and credit conditions.
The company’s strategy still makes sense in that context. Its banking arm gives it access to financing activity inside China’s economy, while its industrial and materials assets align with areas such as manufacturing upgrades, energy transition supply chains, and infrastructure renewal. The Australian iron ore operation remains strategically valuable because high-quality ore is important to steel production, and CITIC’s special steel activities connect it to autos, wind power, machinery, and industrial equipment.
Revenue growth has been inconsistent. There have been periods of contraction followed by strong rebounds, which is typical for a conglomerate exposed to commodities, project timing, and financial cycles. The latest year-over-year trend looks improved, but the longer pattern is not smooth enough to describe the company as a dependable compounder on the revenue line.
Cash generation deserves careful attention. Despite a very strong trailing free cash flow figure in the latest metrics, the recent historical pattern shows negative free cash flow in multiple periods. That suggests working-capital movements, project spending, or financing-linked balance-sheet effects can materially change the picture from one reporting period to the next. For a long-term analysis, this makes underlying cash conversion more important than any single year’s headline number.
A meaningful catalyst is the group’s broad exposure to Chinese policy-backed sectors. If credit demand improves, infrastructure activity stabilizes, industrial production strengthens, or steel and raw-material conditions become more favorable, several parts of the company could benefit at once. The banking arm is especially important here because even moderate improvement in loan growth or asset quality can have a large effect on consolidated earnings.
Recent company communications have also continued to emphasize advanced materials, manufacturing capability, and coordination across industrial and financial businesses. That does not remove cyclicality, but it supports the idea that CITIC is positioned around sectors the Chinese state considers strategically important over the long term.
Risks
This article is for informational purposes only and does not constitute financial advice. Some content is AI-generated. See Disclaimer