Stock Analysis · CITIC Limited (CTPCF)
Overview
CITIC Limited is one of China’s largest conglomerates. Through a wide collection of subsidiaries and investments, it operates across industrial businesses, natural resources, engineering and construction, advanced materials, energy services, real estate, and financial services. The group is controlled by the state-owned CITIC Group and is listed in Hong Kong, while CTPCF is the over-the-counter share line in the U.S. For long-term analysis, the key point is that CITIC is not a pure-play company: it is a diversified platform tied closely to major parts of the Chinese economy.
The business mix is led by industrial and resource-related operations, with financial services also playing an important role. Based on recent annual disclosures, the main revenue sources are approximately the following:
- Advanced materials and manufacturing, special steel: about 25% to 30% of revenue. This mainly includes special steel products used in autos, energy, machinery, infrastructure, and industrial equipment.
- Engineering contracting and infrastructure-related activities: about 20% to 25%. This includes engineering, construction, and services tied to large domestic and overseas projects.
- Resources and energy: about 15% to 20%. The largest item here is iron ore through CITIC Pacific Mining in Australia, with additional exposure to energy and commodities.
- Financial services: about 10% to 15% of revenue, but usually a larger share of profit than of revenue. This includes banking, securities, trust, insurance, and asset management interests, especially through CITIC Financial Holdings and related platforms.
- Consumer and other industrial businesses: about 10% to 15%. This covers areas such as heavy machinery, automotive-related operations, and other diversified industrial activities.
- Real estate and other segments: generally under 10%. These include property development, land holdings, and smaller business lines.
This structure matters because CITIC’s earnings are supported by several engines rather than one product line. At the same time, that complexity can make the group harder to value than simpler industrial companies.
The operating flow shows a very large revenue base with recurring profitability, but also meaningful swings between gross profit, operating profit, and net income over time. That pattern fits a diversified group exposed to commodities, construction cycles, and financial operations, where headline sales can remain huge even while margins and earnings move around more noticeably.
Key Figures
| Metric | Value | Sector ⓘ |
|---|---|---|
| Date | Oct 03, 2026 | |
| Context | ||
| Sector | Industrials | |
| Industry | Conglomerates | |
| Market Cap ⓘ | $42.18B | |
| Beta ⓘ | 0.87 | |
Value (Cheapness) | ||
| P/E Ratio ⓘ | 4.68 | 22.45 |
| P/B Ratio ⓘ | 0.27 | 1.98 |
| FCF Yield ⓘ | 1313.31% | 6.31% |
| Dividend Yield ⓘ | 41.03% | 1.96% |
| EBIT / EV ⓘ | 176.54% | 4.81% |
| PEG ⓘ | N/A | |
Growth (Business expansion) | ||
| Revenue Growth ⓘ | 6.70% | 9.10% |
| RPS Growth (5Y CAGR) ⓘ | -2.02% | 7.75% |
| EPS Growth (5Y CAGR) ⓘ | -18.40% | -13.59% |
| BVPS Growth (5Y CAGR) ⓘ | 20.55% | 6.22% |
| Margin Growth (5Y Trend) ⓘ | 3.08% | 0.72% |
| FCF Growth (5Y CAGR) ⓘ | N/A | 10.98% |
| DPS Growth (5Y CAGR) ⓘ | 3.06% | 9.48% |
Quality (Business durability) | ||
| ROIC (Latest) ⓘ | N/A | 10.92% |
| ROA (Latest) ⓘ | 0.82% | 5.41% |
| ROIC (5Y Median) ⓘ | 4.71% | 9.21% |
| ROA (5Y Median) ⓘ | 0.52% | 4.94% |
| Net Debt / EBIT (Latest) ⓘ | N/A | 2.07 |
| Net Debt / EBIT (5Y Median) ⓘ | 11.70 | 2.28 |
| Net Debt / EBITDA (Latest) ⓘ | N/A | 1.43 |
| Net Debt / Assets ⓘ | 9.51% | 19.27% |
| EBITDA / Interest ⓘ | 3.07 | 9.53 |
| Operating Margin (Latest) ⓘ | 25.37% | 10.50% |
| Operating Margin (5Y Median) ⓘ | 17.47% | 10.27% |
| Debt to Equity (Latest) ⓘ | 326.64% | 65.48% |
| Profit Margin (Latest) ⓘ | 6.28% | 6.62% |
| Free Cash Flow (Latest) ⓘ | $553.96B | |
Momentum (Price trend) | ||
| 3Y Return ⓘ | +103.51% | +58.56% |
| 12M Return (excl. last month) ⓘ | -6.33% | +15.63% |
| 6M Return ⓘ | +3.12% | +4.19% |
| Price vs. 200-Day MA ⓘ | +38.65% | +0.93% |
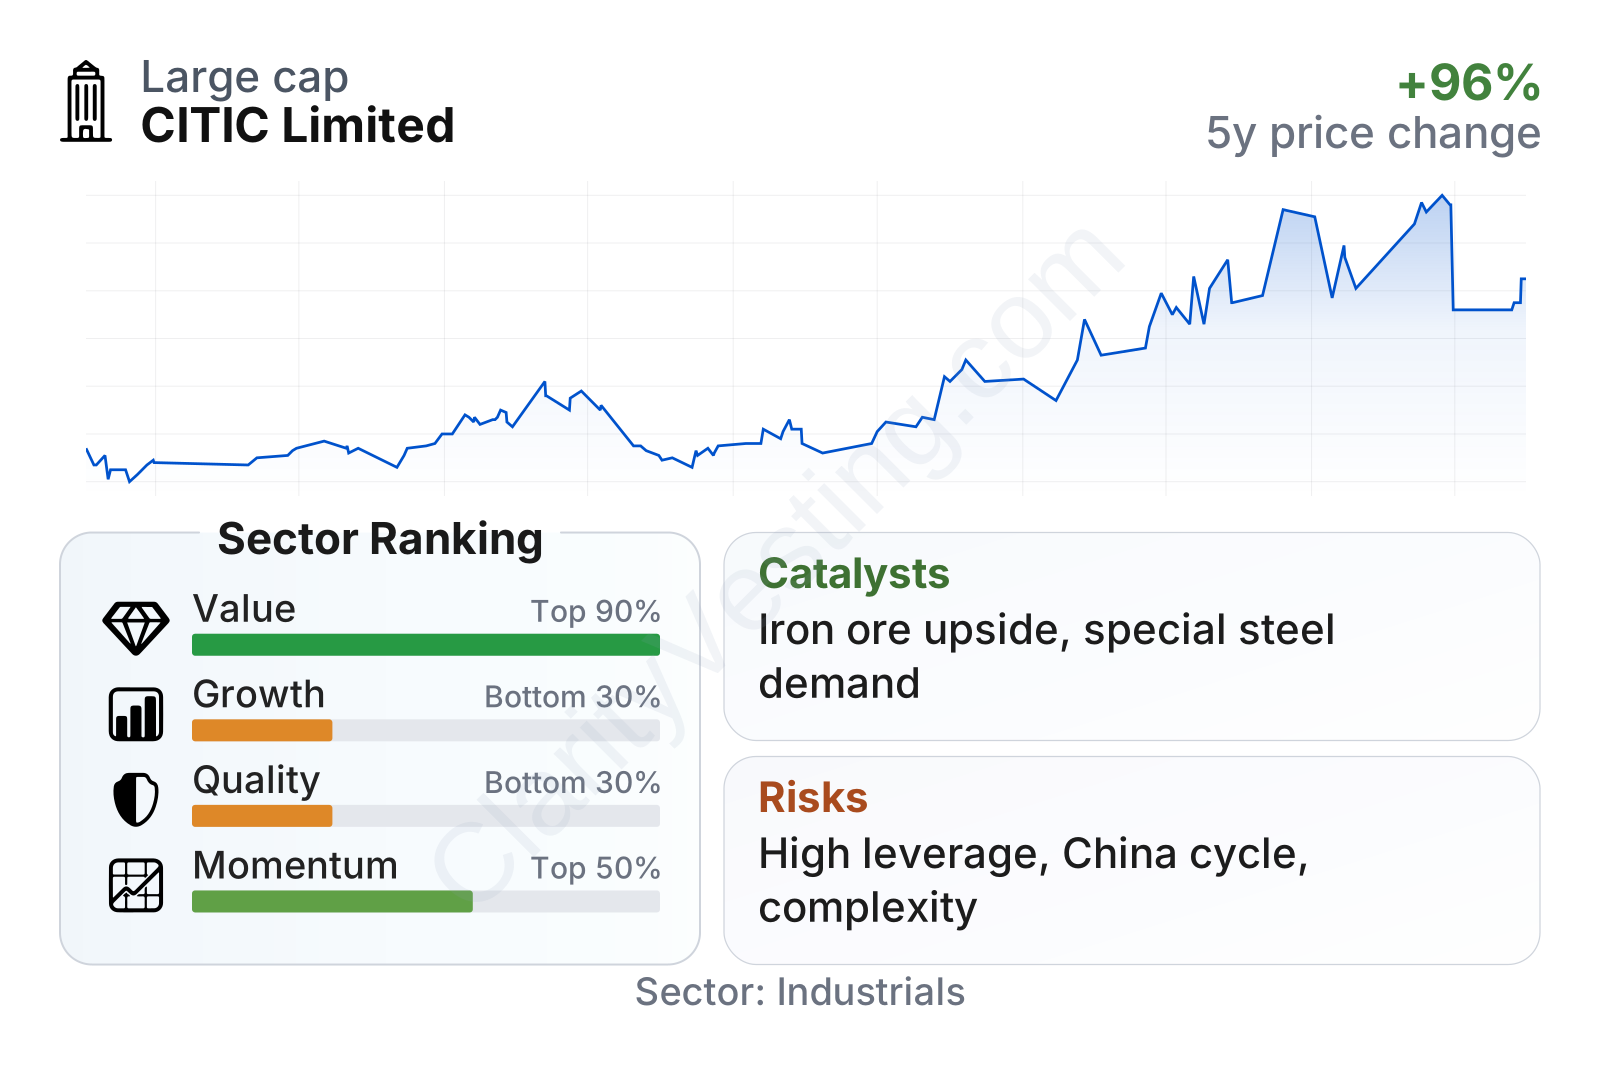
CITIC stands out on valuation metrics. Its earnings multiple is far below the sector median, price-to-book is extremely low, and free cash flow yield is unusually high. Dividend yield is also elevated. On the other hand, the company ranks weakly on growth and quality relative to the broader industrial sector, which helps explain why the market is not assigning it a richer multiple. The picture is essentially one of a very inexpensive large-cap group with modest growth, mixed returns on capital, and balance-sheet complexity.
The stock’s longer-term share performance has been strong from the 2021 period to mid-2026, even though shorter-term momentum has been less impressive. That combination often appears when a stock rerates from very depressed levels but still carries investor caution.
Growth
CITIC operates in sectors that are mature rather than uniformly high-growth. Steel, bulk resources, construction, and traditional finance are not fast-growing industries by nature. However, some of CITIC’s niches are more attractive than the headline conglomerate label suggests. Special steel benefits from demand tied to higher-end manufacturing, energy equipment, transportation, and industrial upgrading. Iron ore remains strategically important because it feeds steelmaking, and engineering capabilities can benefit from infrastructure spending and overseas project activity.
The group’s strategy is built around diversification, vertical links across industries, and alignment with national economic priorities. That approach can support resilience if one segment weakens while another improves. It also gives CITIC access to large projects, financing channels, and strategic assets that are difficult for smaller rivals to replicate. For future growth, the most credible path is not explosive expansion, but steadier gains from industrial upgrading, supply-chain importance, and capital recycling within the portfolio.
Recent top-line growth appears positive but not especially fast compared with the broader industrial sector. Over a longer period, revenue per share and earnings growth have been uneven, which suggests that CITIC’s expansion has been influenced as much by cycles and asset mix as by organic compounding. A more encouraging point is that operating margin trends have improved over five years, indicating that parts of the portfolio may be becoming more efficient or shifting toward better economics.
Recent company updates have also pointed to continuing focus on advanced materials, manufacturing capability, and strategic resource assets. For a group like CITIC, major catalysts tend to come from stronger commodity conditions, better profitability at the Australian iron ore operation, stabilization in China’s macro environment, and improved returns from financial subsidiaries. Any clearer simplification of the corporate structure or disposals of lower-return assets could also become meaningful opportunities because the valuation discount is so large.
Risks
This article is for informational purposes only and does not constitute financial advice. Some content is AI-generated. See Disclaimer


