Stock Analysis · Community Trust Bancorp Inc (CTBI)
Overview
Community Trust Bancorp, Inc. is a regional banking company headquartered in Kentucky. Through its main subsidiary, Community Trust Bank, it provides everyday banking services to individuals, small businesses, and commercial customers across Kentucky, West Virginia, and Tennessee. Its activities are centered on taking deposits, making loans, managing customer cash, and offering related financial services. The group also operates insurance and wealth management businesses, which add fee income alongside traditional banking revenue.
For a bank like CTBI, revenue does not look like a manufacturer’s sales mix. The largest source usually comes from the spread between what it earns on loans and securities and what it pays on deposits and other funding. Based on recent annual filings, the company’s revenue base is primarily made up of:
- Net interest income: about 75% to 85% of total revenue in recent years. This is the core banking engine and includes interest earned on commercial loans, real estate loans, consumer loans, and investment securities, minus interest paid on deposits and borrowings.
- Insurance commissions and fees: about 6% to 10%. This comes from the company’s insurance agency operations.
- Trust and wealth management income: about 3% to 6%. This includes fiduciary, investment management, and related account fees.
- Service charges, debit and card fees, and other deposit account fees: about 3% to 5%. These are customer banking service fees.
- Mortgage, loan-related, and other noninterest income: usually low single-digit percentages when combined precisely unavailable. This area can include loan servicing, gains on sales, and miscellaneous banking fees.
That mix matters because CTBI is still, above all, a spread-based regional bank. The insurance and trust businesses help diversify results, but they are not large enough to outweigh the importance of loan growth, deposit costs, credit quality, and interest rates. Over the last several years, total revenue has moved higher overall, while net income stayed comparatively resilient even as funding costs rose sharply across the banking sector.
The company’s revenue has grown clearly since 2021, and earnings have also improved over the full period, although with pressure in the middle years as interest expense climbed. That pattern is typical for many regional banks after rates moved up: revenue rose, but the benefit was partly offset by higher funding costs and somewhat heavier operating expenses.
Key Figures
| Metric | Value | Sector ⓘ |
|---|---|---|
| Date | Oct 24, 2026 | |
| Context | ||
| Sector | Financial Services | |
| Industry | Banks - Regional | |
| Market Cap ⓘ | $1.24B | |
| Beta ⓘ | 0.56 | |
Value (Cheapness) | ||
| P/E Ratio ⓘ | 11.24 | 12.46 |
| P/B Ratio ⓘ | 1.44 | 1.25 |
| FCF Yield ⓘ | 10.13% | 9.82% |
| Dividend Yield ⓘ | N/A | 2.94% |
| EBIT / EV ⓘ | 8.40% | 8.11% |
| PEG ⓘ | 1.03 | |
Growth (Business expansion) | ||
| Revenue Growth ⓘ | 11.20% | 9.10% |
| RPS Growth (5Y CAGR) ⓘ | 14.03% | 12.31% |
| EPS Growth (5Y CAGR) ⓘ | -0.12% | -6.97% |
| BVPS Growth (5Y CAGR) ⓘ | 4.85% | 5.02% |
| Margin Growth (5Y Trend) ⓘ | -15.32% | -4.00% |
| FCF Growth (5Y CAGR) ⓘ | -3.72% | 4.71% |
| DPS Growth (5Y CAGR) ⓘ | 6.17% | 8.92% |
Quality (Business durability) | ||
| ROIC (Latest) ⓘ | 11.65% | 9.18% |
| ROE (Latest) ⓘ | 12.54% | 13.93% |
| ROA (Latest) ⓘ | 1.59% | 1.57% |
| ROIC (5Y Median) ⓘ | 11.26% | 7.80% |
| ROE (5Y Median) ⓘ | 12.15% | 12.15% |
| ROA (5Y Median) ⓘ | 1.52% | 1.28% |
| Net Debt / EBIT (Latest) ⓘ | 2.24 | 1.02 |
| Net Debt / EBIT (5Y Median) ⓘ | 0.36 | 0.72 |
| Net Debt / EBITDA (Latest) ⓘ | 2.16 | 0.88 |
| Operating Margin (Latest) ⓘ | 33.11% | 22.30% |
| Operating Margin (5Y Median) ⓘ | 31.05% | 24.50% |
| Debt to Equity (Latest) ⓘ | 42.33% | 59.34% |
| Profit Margin (Latest) ⓘ | 37.63% | 26.42% |
| Free Cash Flow (Latest) ⓘ | $125.77M | |
Momentum (Price trend) | ||
| 3Y Return ⓘ | +118.87% | +95.73% |
| 12M Return (excl. last month) ⓘ | +38.17% | +17.30% |
| 6M Return ⓘ | +11.84% | +6.07% |
| Price vs. 200-Day MA ⓘ | +4.90% | +5.36% |
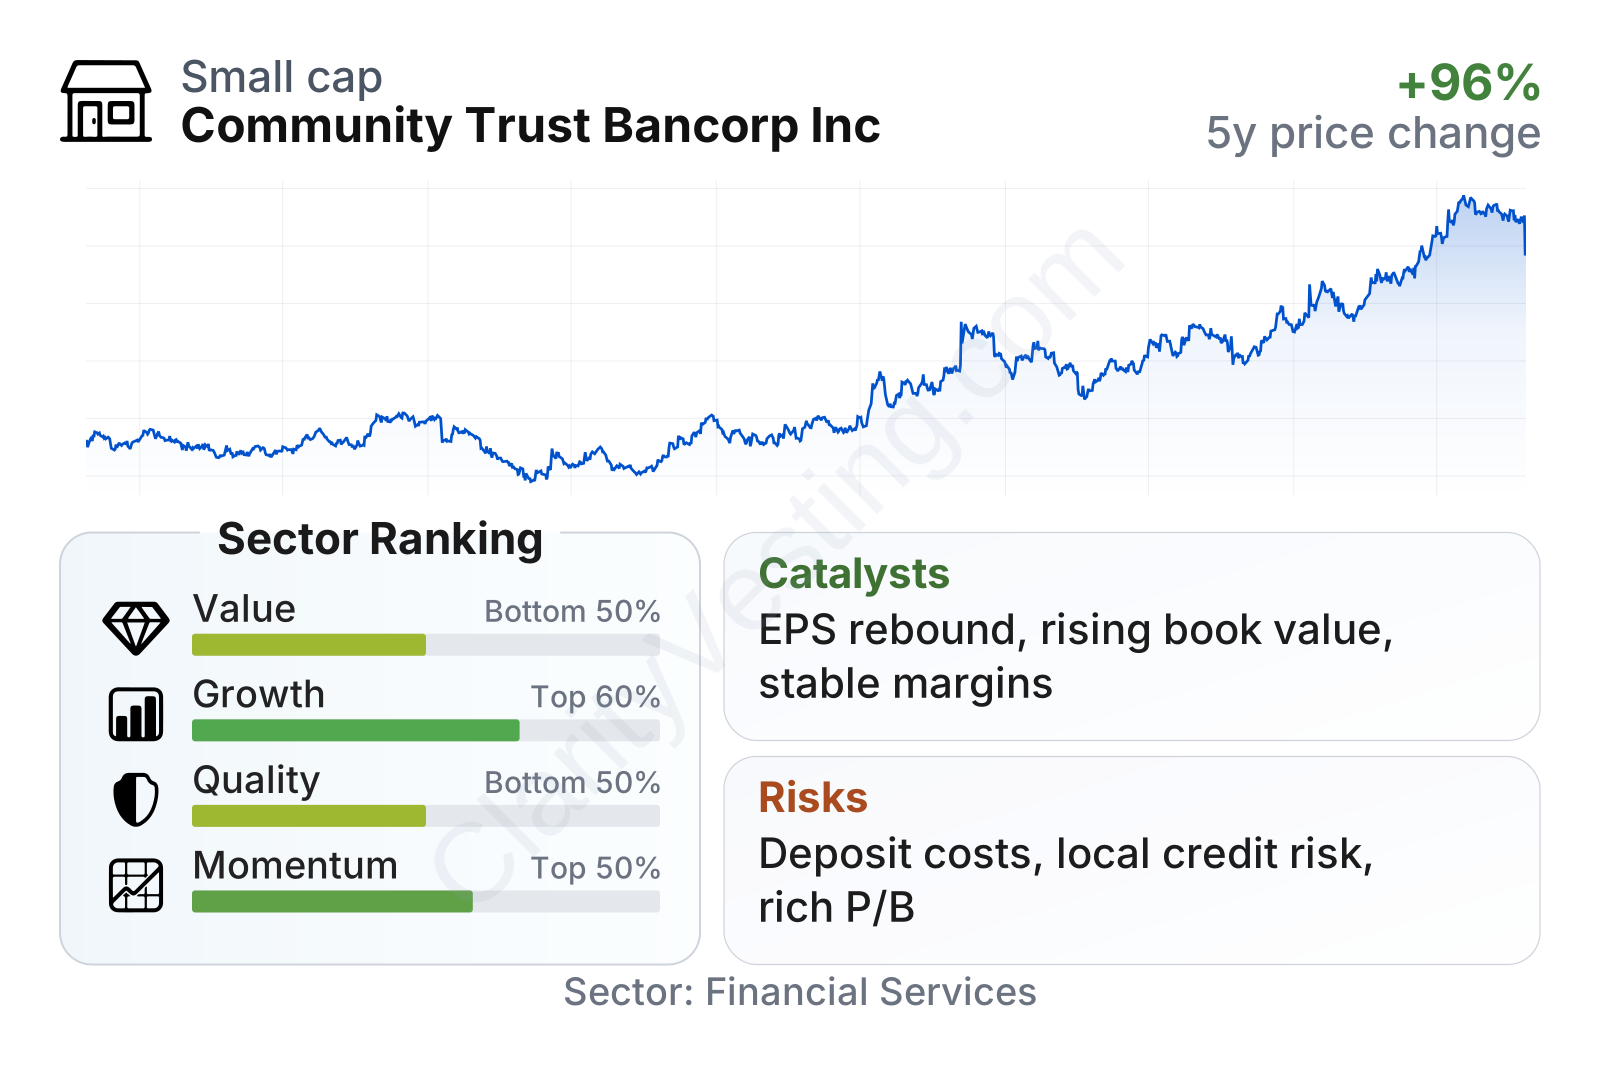
CTBI is a small regional bank by market value, and its shares have shown lower volatility than the broader market, with a beta well below 1. In relative terms, its recent share-price trend has been stronger than much of the regional banking group. On valuation, the earnings multiple is close to the sector median, while the price-to-book ratio sits somewhat above the sector median. Growth metrics look respectable, especially on revenue, but quality measures are more mixed: profitability remains solid, yet not uniformly superior across all measures. The combination suggests a bank that the market is treating as a steady operator rather than a deep discount name.
Growth
CTBI operates in regional banking, a mature industry rather than a high-growth one. That said, mature does not mean stagnant. Banks can still expand through loan growth, market-share gains in local communities, fee-based businesses, and disciplined capital allocation. CTBI’s footprint in parts of Appalachia and neighboring markets gives it exposure to local commercial lending, consumer banking, and small-business relationships where community-focused institutions can remain relevant.
The company’s strategy appears practical rather than aggressive. It relies on long-standing local banking relationships, a branch network in its core markets, and supplemental fee income from insurance and wealth management. For long-term growth, that can make sense: these lines deepen customer relationships and can make revenue a bit less dependent on pure interest spreads. It also helps that book value per share has trended upward again after the 2022 decline, which points to rebuilding balance-sheet value as the interest-rate environment normalized.
Earnings per share fell from 2021 through 2023, then recovered in 2024 and improved further in 2025. That rebound is important because it suggests CTBI has been able to work through the most difficult phase of deposit repricing and margin pressure that affected many regional banks after rates rose.
Book value per share has also strengthened meaningfully since 2022. For banks, this is a closely watched sign because it reflects the underlying equity base supporting the lending franchise. A rising book value, together with recovering earnings, usually indicates that capital generation remains intact.
A potential catalyst for future growth is the interest-rate cycle. If deposit costs stabilize or decline faster than asset yields reset downward, margins can remain healthy. CTBI also benefits from being a long-established community banking platform in markets where local relationships still matter. Recent operating momentum and stronger share performance suggest the market has noticed that earnings resilience.
Recent company updates in 2026 have generally pointed to continued profitability, capital strength, and stable operations rather than a major strategic transformation. For a bank of this type, that kind of consistency can itself be meaningful: the opportunity is usually steady compounding rather than dramatic expansion.
Risks
This article is for informational purposes only and does not constitute financial advice. Some content is AI-generated. See Disclaimer


